Animating a 3D scatterplot with matplotlib
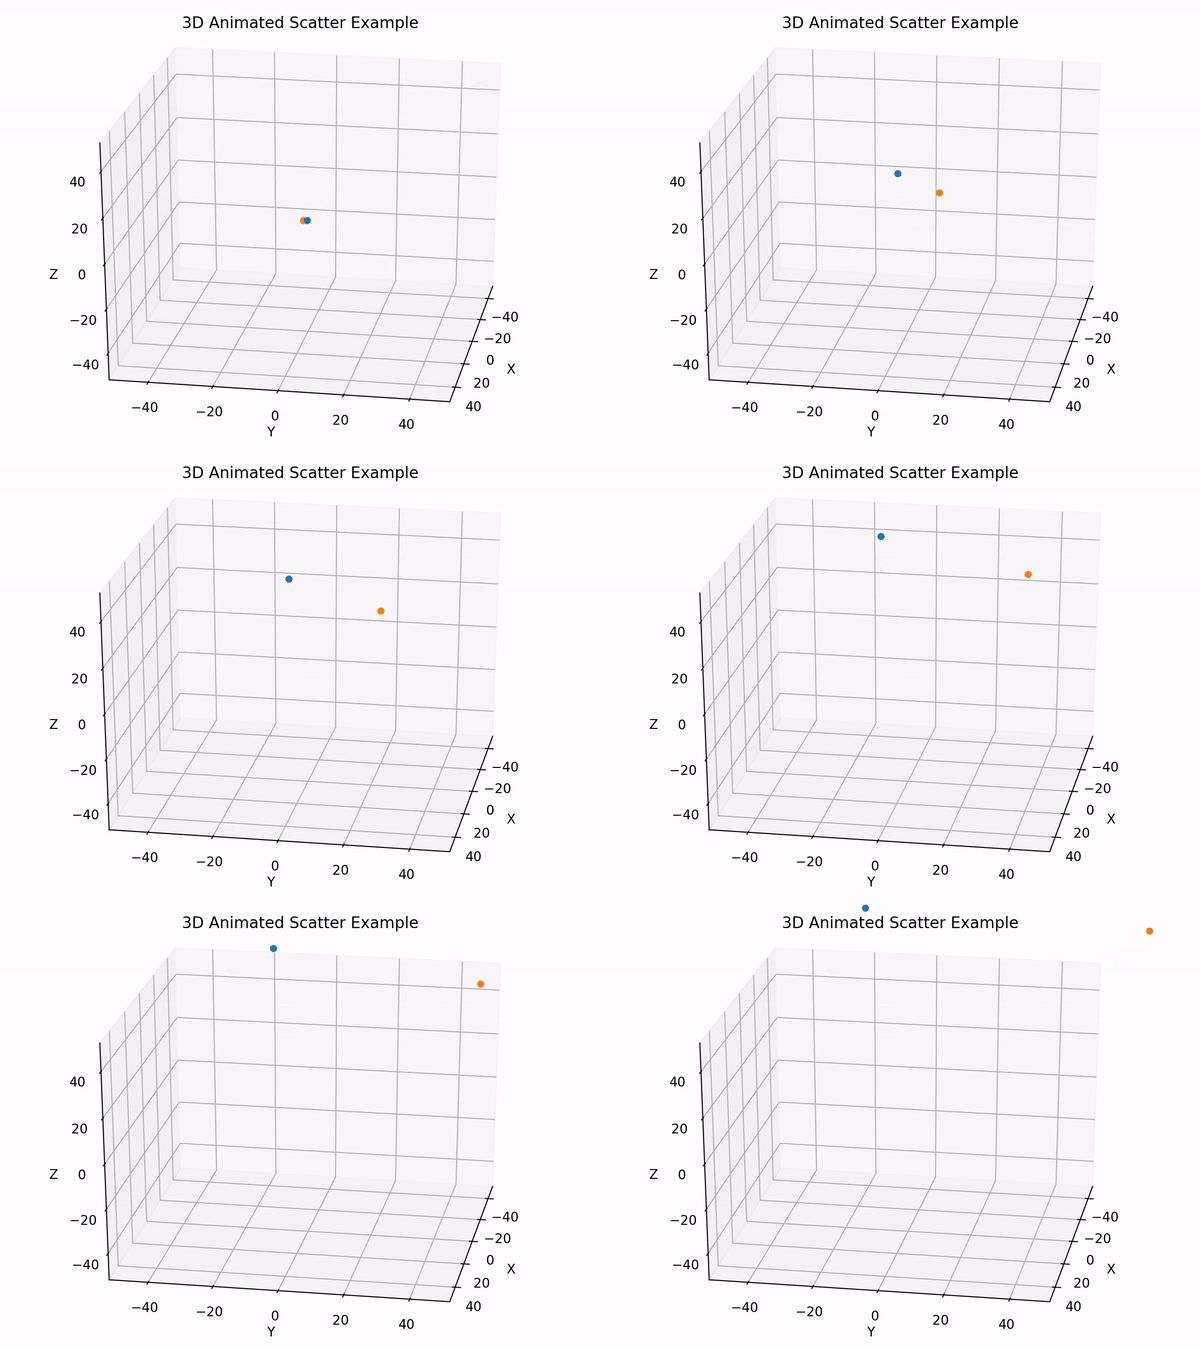
Python, together with Matplotlib allow for easy and powerful data visualisation. It was originally developed for 2D plots, but was later improved to allow for 3D plotting. Furthermore, an animation module also allows for dynamical plotting. That is our goal today: Animate a scatter plot in 3D with Matplotlib.
Generate data
Let’s first generate some dummy data. We want our data-structure to consist of a list of arrays of positions of our animated points (also called elements). Each element of the list being the positions at a different iteration.
def generate_data(nbr_iterations, nbr_elements):
    """
    Generates dummy data.
    The elements will be assigned random initial positions and speed.
    Args:
        nbr_iterations (int): Number of iterations data needs to be generated for.
        nbr_elements (int): Number of elements (or points) that will move.
    Returns:
        list: list of positions of elements. (Iterations x (# Elements x Dimensions))
    """
    dims = (3,1)

    # Random initial positions.
    gaussian_mean = np.zeros(dims)
    gaussian_std = np.ones(dims)
    start_positions = np.array(list(map(np.random.normal, gaussian_mean, gaussian_std, [nbr_elements] * dims[0]))).T

    # Random speed
    start_speed = np.array(list(map(np.random.normal, gaussian_mean, gaussian_std, [nbr_elements] * dims[0]))).T

    # Computing trajectory
    data = [start_positions]
    for iteration in range(nbr_iterations):
        previous_positions = data[-1]
        new_positions = previous_positions + start_speed
        data.append(new_positions)

    return data
Here, as can be seen in the gist above, a simple strategy is adopted. An initial position is randomly sampled, for each element, from a normal distribution. Similarly, a speed is sampled from, for each element, from a normal distribution. At each iteration, the position is updated as below:
\[x_k = x_{k-1} + v\]Animation Function
The animation of the Matplotlib figure requires an animation function as explained in the doc. This function’s purpose is to update the data of the different plots contained in the figure.
def animate_scatters(iteration, data, scatters):
    """
    Update the data held by the scatter plot and therefore animates it.
    Args:
        iteration (int): Current iteration of the animation
        data (list): List of the data positions at each iteration.
        scatters (list): List of all the scatters (One per element)
    Returns:
        list: List of scatters (One per element) with new coordinates
    """
    for i in range(data[0].shape[0]):
        scatters[i]._offsets3d = (data[iteration][i,0:1], data[iteration][i,1:2], data[iteration][i,2:])
    return scatters
Here again it is pretty simple, for a given iteration, the value shown by the scatters (There is one scatter per point) is updated with the associated coordinates.
Please note the use of data[iteration][i,0:1] and not data[iteration][i,0]. This is because the scatter function of Matplotlib expects an object with a len, and therefore not a number.
Please also note the use of _offsets3d. It is a private and is a workaround found here.
Main Function
Finally, a main function, which regroups the creation of the figure, some utilities and most importantly the call to animate the figure, is required.
def main(data, save=True):
    """
    Creates the 3D figure and animates it with the input data.
    Args:
        data (list): List of the data positions at each iteration.
        save (bool): Whether to save the recording of the animation. (Default to False).
    """

    # Attaching 3D axis to the figure
    fig = plt.figure()
    ax = p3.Axes3D(fig)

    # Initialize scatters
    scatters = [ ax.scatter(data[0][i,0:1], data[0][i,1:2], data[0][i,2:]) for i in range(data[0].shape[0]) ]

    # Number of iterations
    iterations = len(data)

    # Setting the axes properties
    ax.set_xlim3d([-50, 50])
    ax.set_xlabel('X')

    ax.set_ylim3d([-50, 50])
    ax.set_ylabel('Y')

    ax.set_zlim3d([-50, 50])
    ax.set_zlabel('Z')

    ax.set_title('3D Animated Scatter Example')

    # Provide starting angle for the view.
    ax.view_init(25, 10)

    ani = animation.FuncAnimation(fig, animate_scatters, iterations, fargs=(data, scatters),
                                       interval=50, blit=False, repeat=True)

    if save:
        Writer = animation.writers['ffmpeg']
        writer = Writer(fps=30, metadata=dict(artist='Me'), bitrate=1800, extra_args=['-vcodec', 'libx264'])
        ani.save('3d-scatted-animated.mp4', writer=writer)

    plt.show()
Please remark that it allows to save the animated scatter plot under a mp4 file. You might experience troubles when trying to save. FFMPEG is indeed required. I was able to solve this issue, on OS X, by running in the terminal:
brew install yasm
brew install ffmpeg
pip install ffmpeg-python
Full Script
The full running script is accessible with the following gist:
# IMPORTS
import numpy as np
import matplotlib.pyplot as plt
import mpl_toolkits.mplot3d.axes3d as p3
import matplotlib.animation as animation

def generate_data(nbr_iterations, nbr_elements):
    """
    Generates dummy data.
    The elements will be assigned random initial positions and speed.
    Args:
        nbr_iterations (int): Number of iterations data needs to be generated for.
        nbr_elements (int): Number of elements (or points) that will move.
    Returns:
        list: list of positions of elements. (Iterations x (# Elements x Dimensions))
    """
    dims = (3,1)

    # Random initial positions.
    gaussian_mean = np.zeros(dims)
    gaussian_std = np.ones(dims)
    start_positions = np.array(list(map(np.random.normal, gaussian_mean, gaussian_std, [nbr_elements] * dims[0]))).T

    # Random speed
    start_speed = np.array(list(map(np.random.normal, gaussian_mean, gaussian_std, [nbr_elements] * dims[0]))).T

    # Computing trajectory
    data = [start_positions]
    for iteration in range(nbr_iterations):
        previous_positions = data[-1]
        new_positions = previous_positions + start_speed
        data.append(new_positions)

    return data

def animate_scatters(iteration, data, scatters):
    """
    Update the data held by the scatter plot and therefore animates it.
    Args:
        iteration (int): Current iteration of the animation
        data (list): List of the data positions at each iteration.
        scatters (list): List of all the scatters (One per element)
    Returns:
        list: List of scatters (One per element) with new coordinates
    """
    for i in range(data[0].shape[0]):
        scatters[i]._offsets3d = (data[iteration][i,0:1], data[iteration][i,1:2], data[iteration][i,2:])
    return scatters

def main(data, save=False):
    """
    Creates the 3D figure and animates it with the input data.
    Args:
        data (list): List of the data positions at each iteration.
        save (bool): Whether to save the recording of the animation. (Default to False).
    """

    # Attaching 3D axis to the figure
    fig = plt.figure()
    ax = p3.Axes3D(fig)

    # Initialize scatters
    scatters = [ ax.scatter(data[0][i,0:1], data[0][i,1:2], data[0][i,2:]) for i in range(data[0].shape[0]) ]

    # Number of iterations
    iterations = len(data)

    # Setting the axes properties
    ax.set_xlim3d([-50, 50])
    ax.set_xlabel('X')

    ax.set_ylim3d([-50, 50])
    ax.set_ylabel('Y')

    ax.set_zlim3d([-50, 50])
    ax.set_zlabel('Z')

    ax.set_title('3D Animated Scatter Example')

    # Provide starting angle for the view.
    ax.view_init(25, 10)

    ani = animation.FuncAnimation(fig, animate_scatters, iterations, fargs=(data, scatters),
                                       interval=50, blit=False, repeat=True)

    if save:
        Writer = animation.writers['ffmpeg']
        writer = Writer(fps=30, metadata=dict(artist='Me'), bitrate=1800, extra_args=['-vcodec', 'libx264'])
        ani.save('3d-scatted-animated.mp4', writer=writer)

    plt.show()


data = generate_data(100, 2)
main(data, save=True)
Other Works
I’d like to give a shoutout to two very nice tutorials about animation with Matplotlib.
- Animations with Matplotlib by Parul Pandey
- Matplotlib animation tutorial by Jake VanderPlas
And to the official example from matplotlib, which is very instructive on the general animation Mechanism.

