Prometheus's pride; understanding the scale of our thirst for fire
Prometheus
The titan Prometheus, feeling sorrow for humanity’s feeble and naked state, stole the sacred fire from the gods to give to mankind. Humanity has not put this gift to waste; our entire civilisation rests on the ubiquitous fire of fossil fuels, argues Peter Sloterdijk in Prometheus’s Remorse: From the Gift of Fire to Global Arson. This insatiable fire is everywhere around us, yet it’s close to impossible for us to understand the orders of magnitude involved in its constant renewal. I attempted to train a computer vision model to automatically count oil wells from satellite imagery, only to realise that ultimately, no tool can imprint the gigantism of fossil fuel infrastructures in our minds.
Our thirst for fire
For most of us, fossil fuels are intangible. We come close to their physicality when refueling a car, but even then, we don’t even see liter after liter of gasoline beeing poured into the tank. It is hidden from our sight. We turn on the engine, move on, never to see the exhaust gases.
For those of us who are interested in studying their significance for our cultures, or the effect of their burning on climate change, this makes it extremely hard to understand the scale of their usage. Sure, we can read that more than 81 000 000 of barrels (that is 12 879 000 000 liters; yes it’s a lot of zeros!) of crude oil are extracted every day, but that number is so unimaginably large that it makes it impossible to comprehend its meaning.
On rare occasions, a sense of that scale can nevertheless seep in our field of view. I can remember very distinctly two of these occasions.
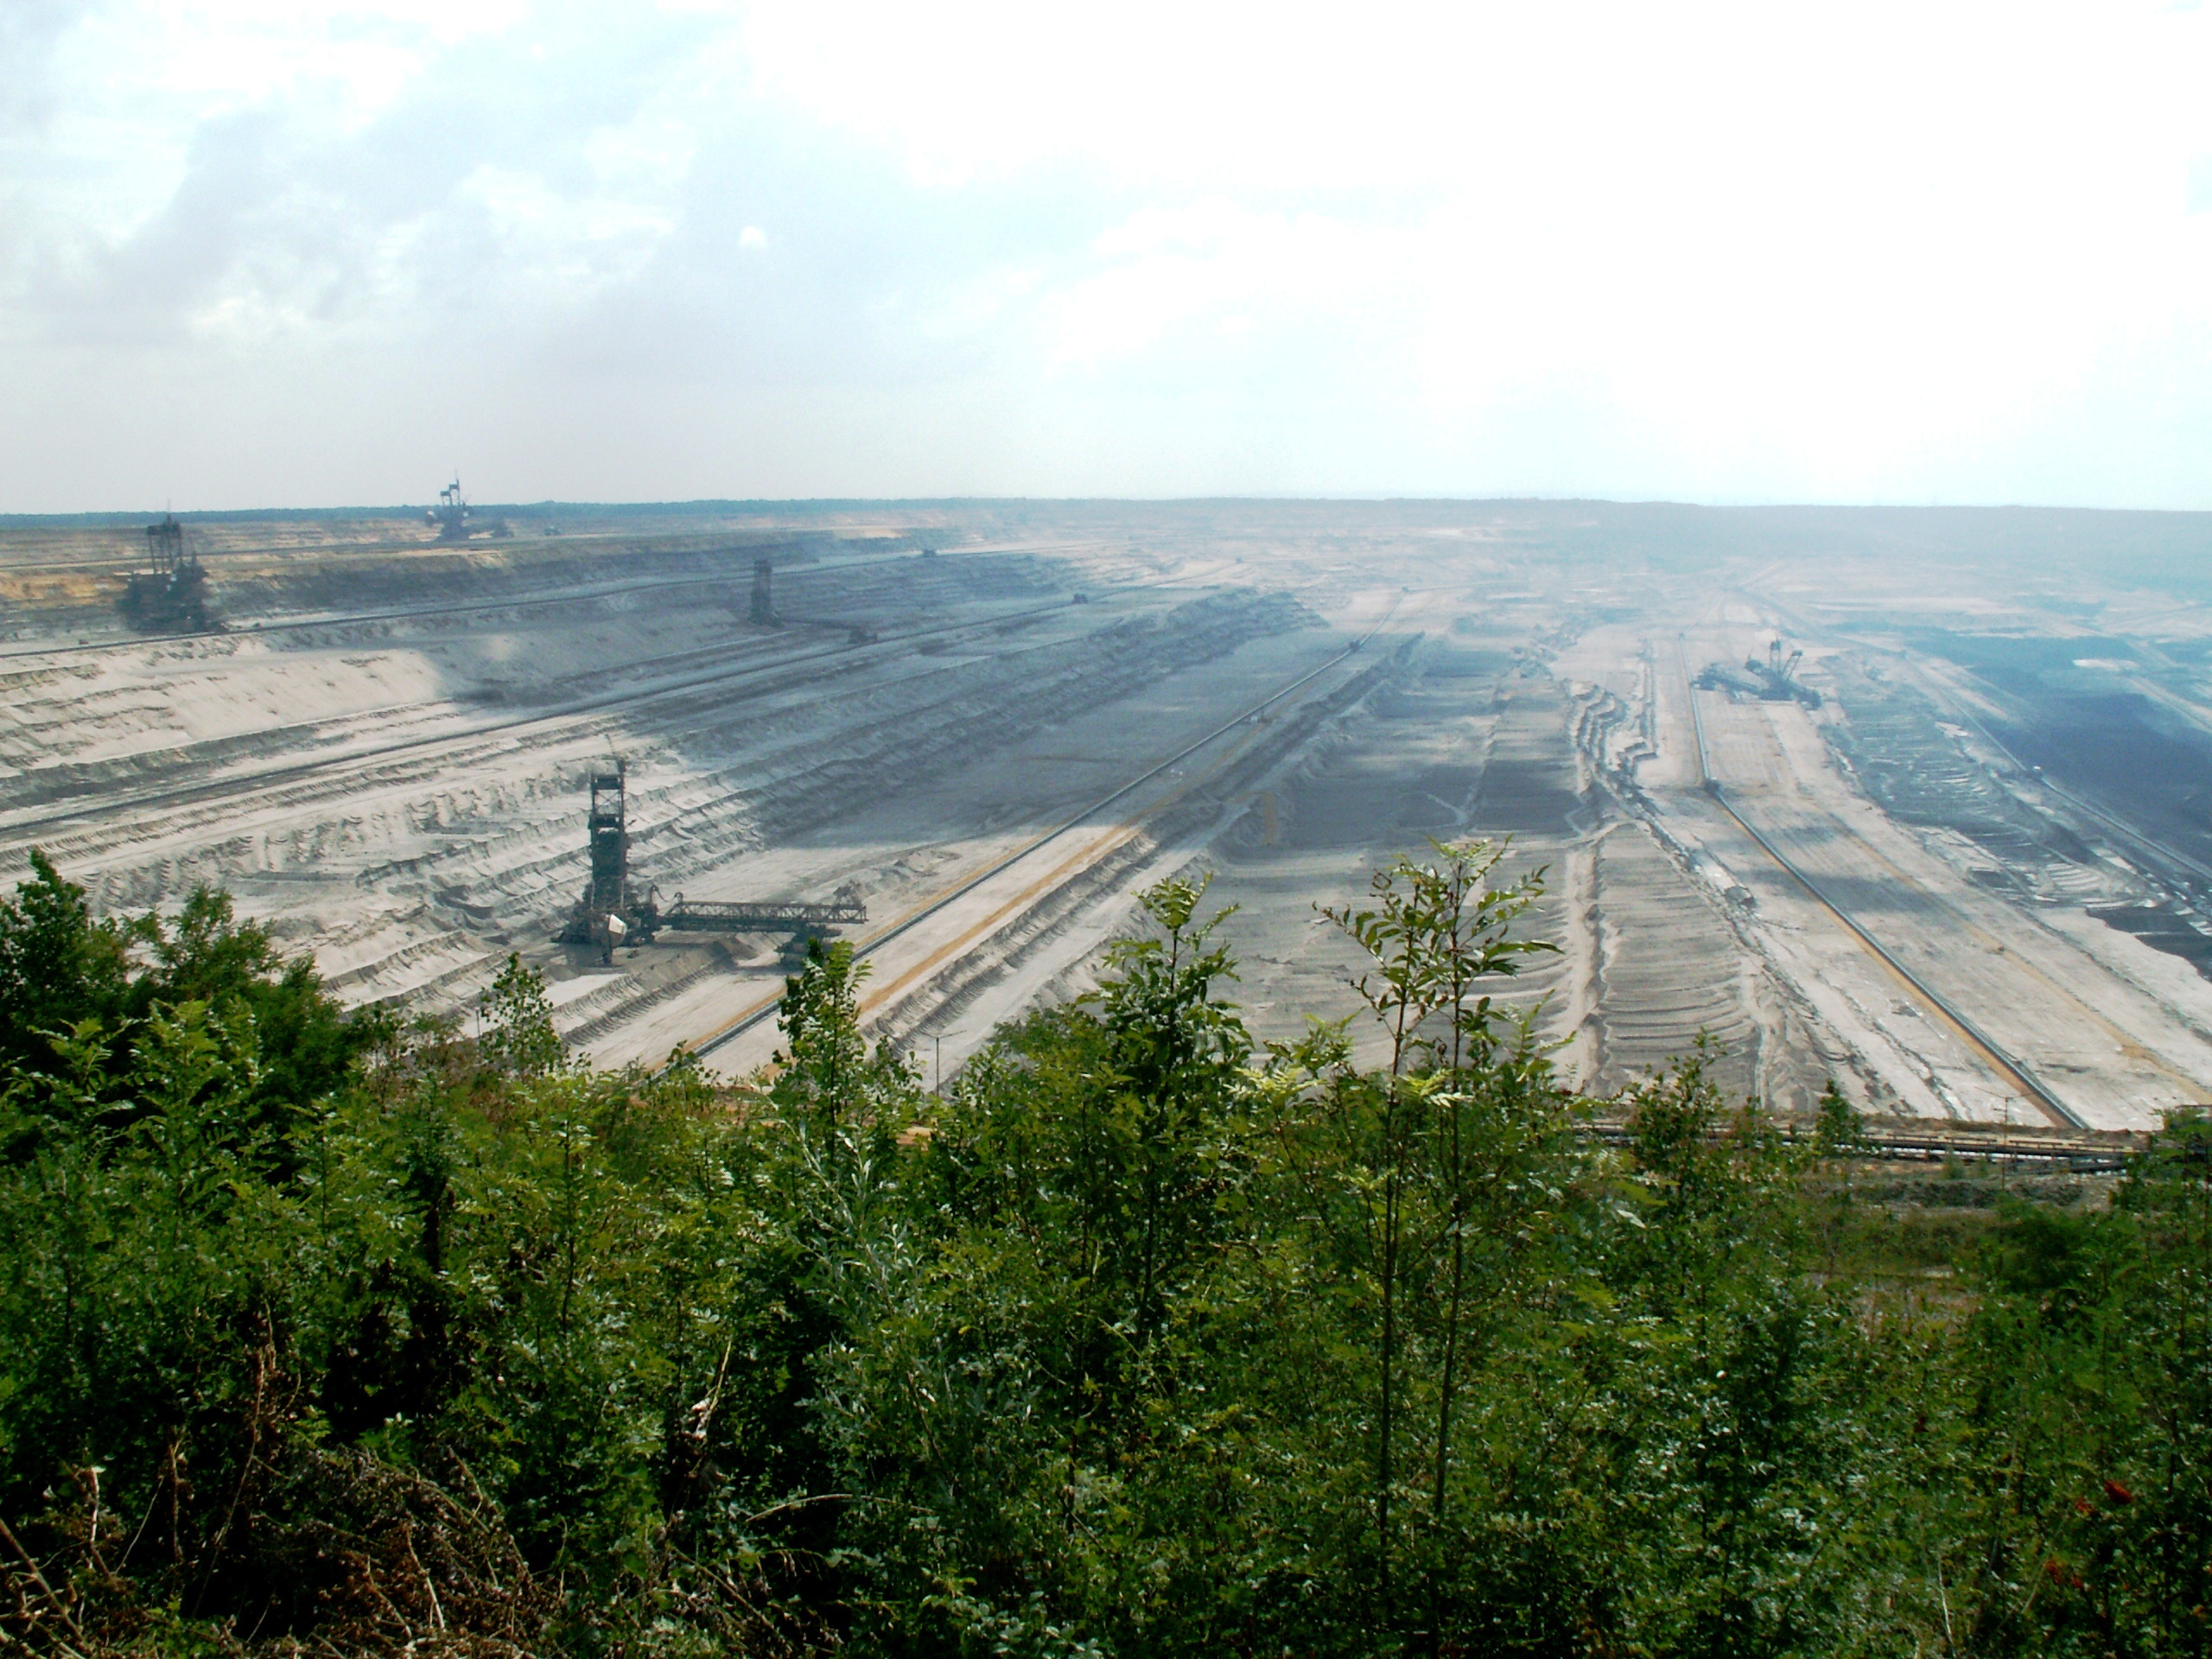
A few years ago, while driving on the highway in North Rine-Westphalia in Germany, I noticed a few hundred meters off the side of the highway a large opening in the ground. It took me a few seconds to make sense of what I was seeing. For kilometers on end, and far into the horizon, the ground had been expunged.
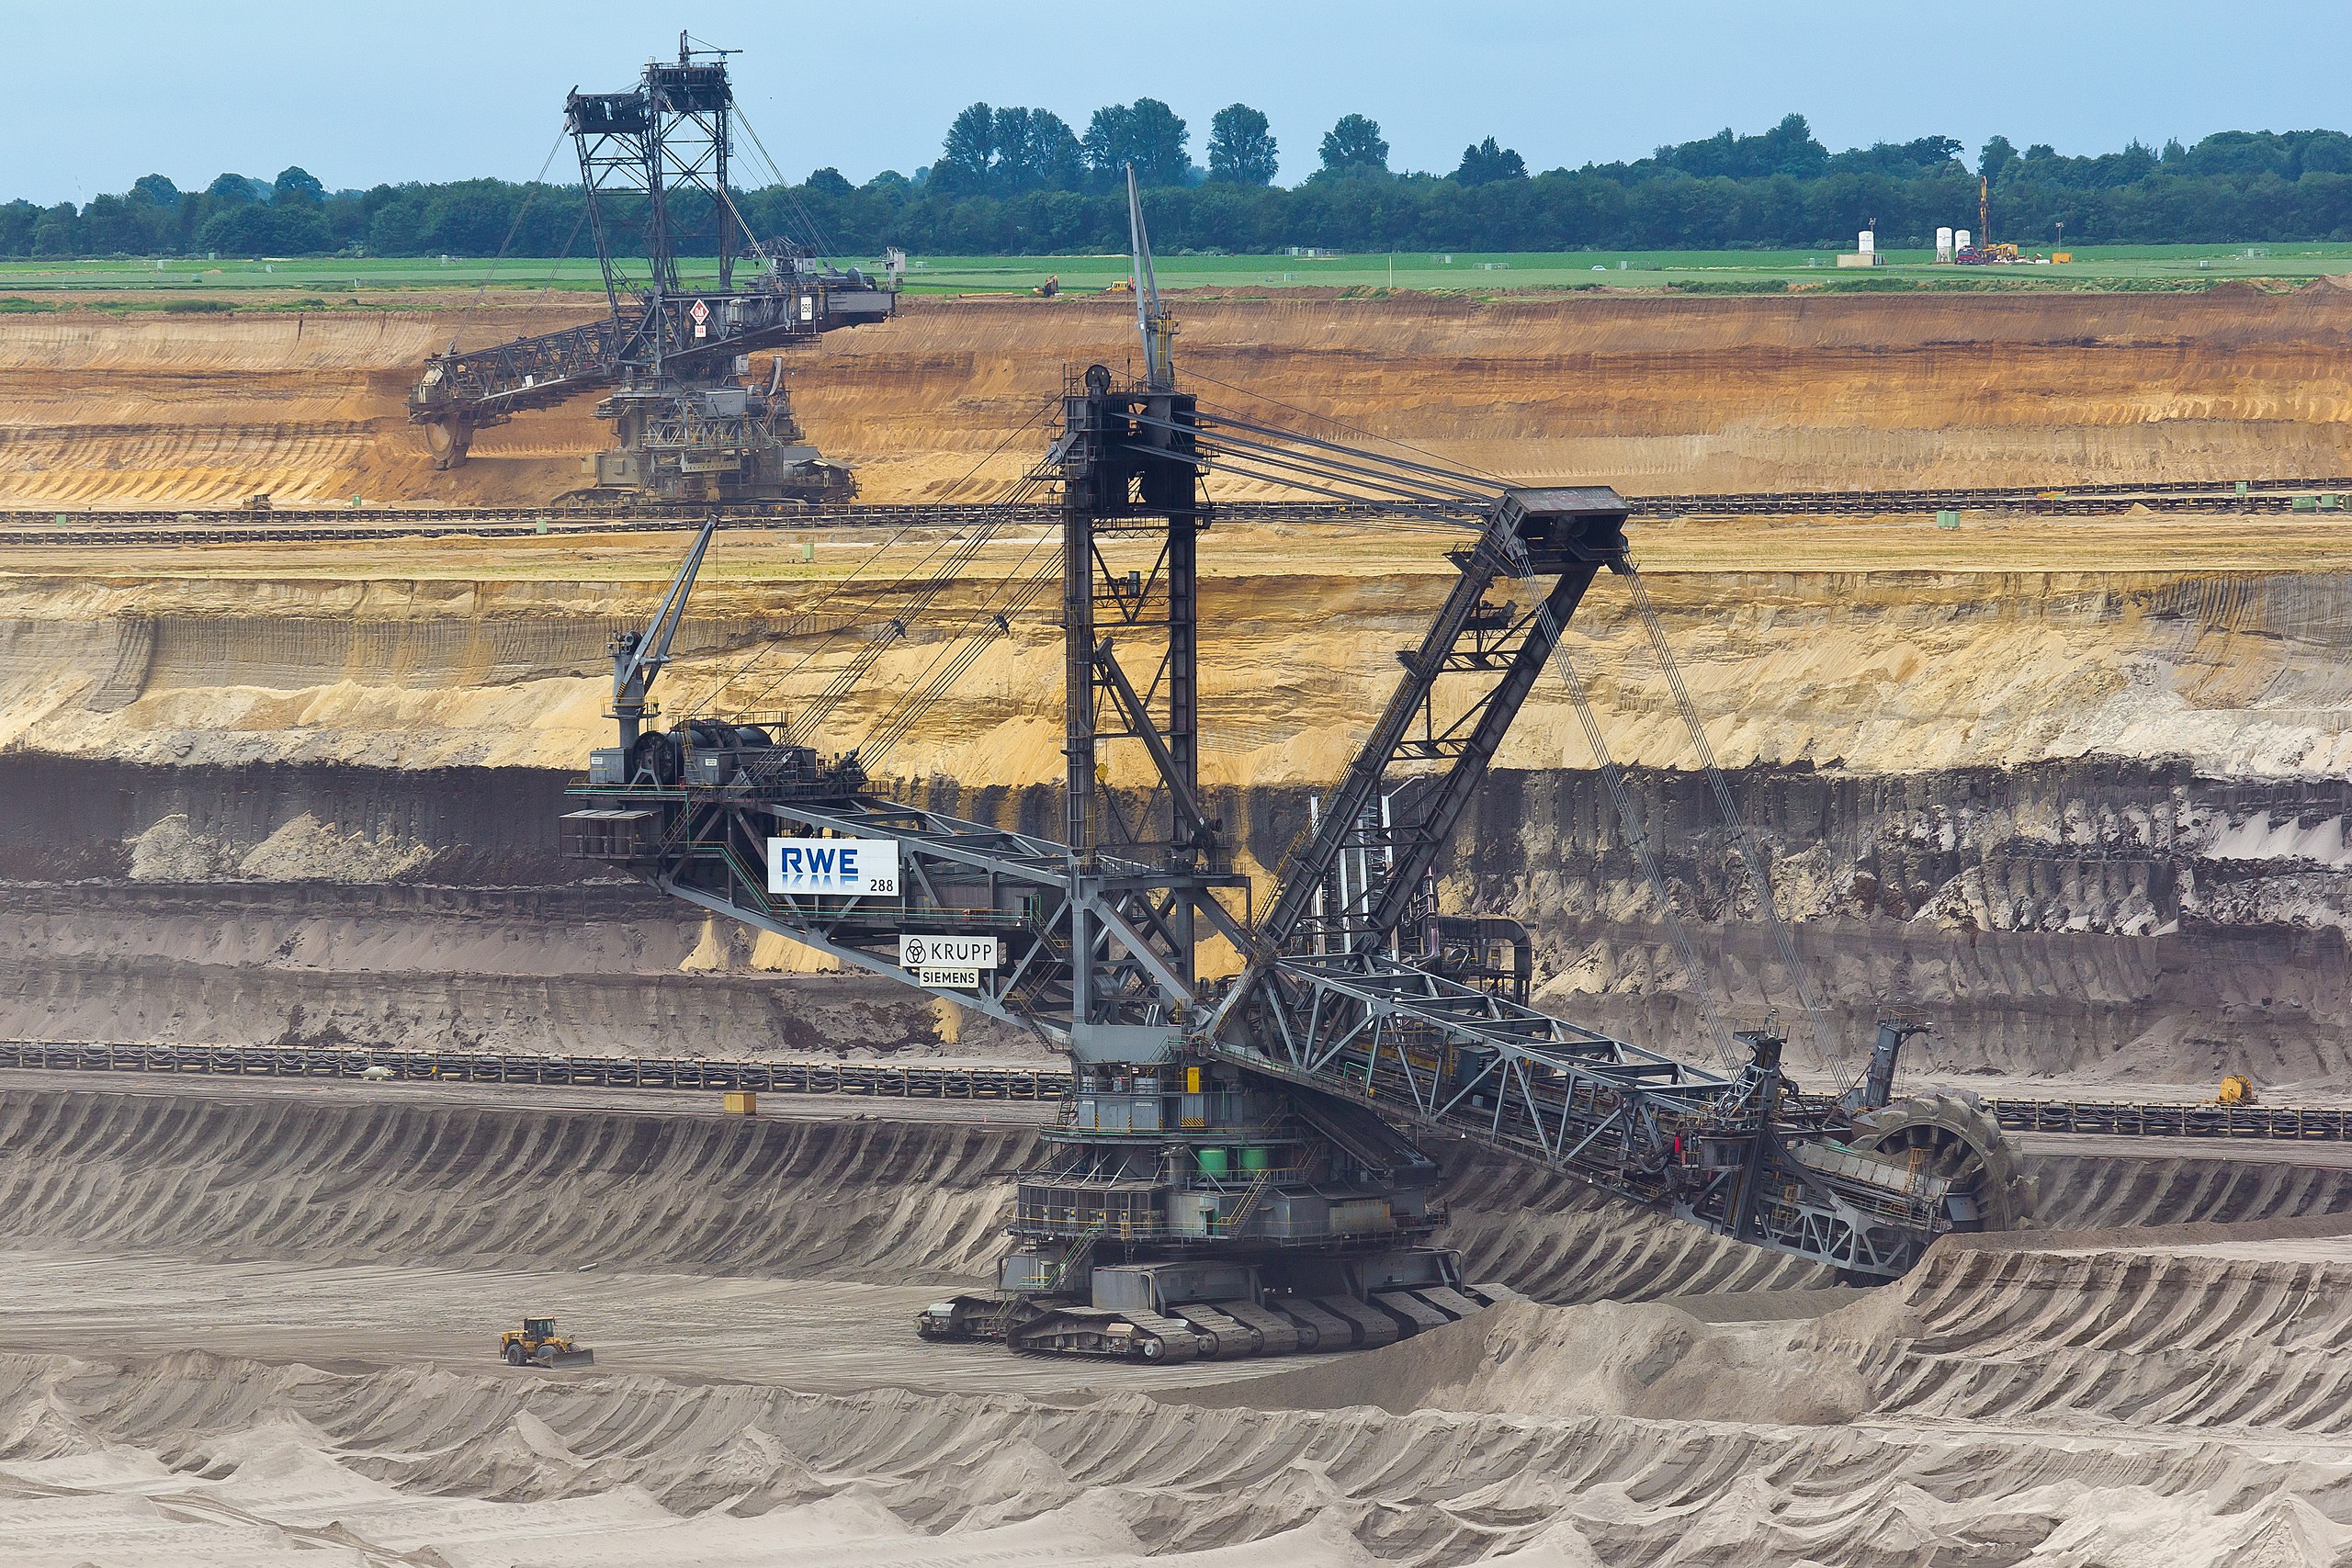
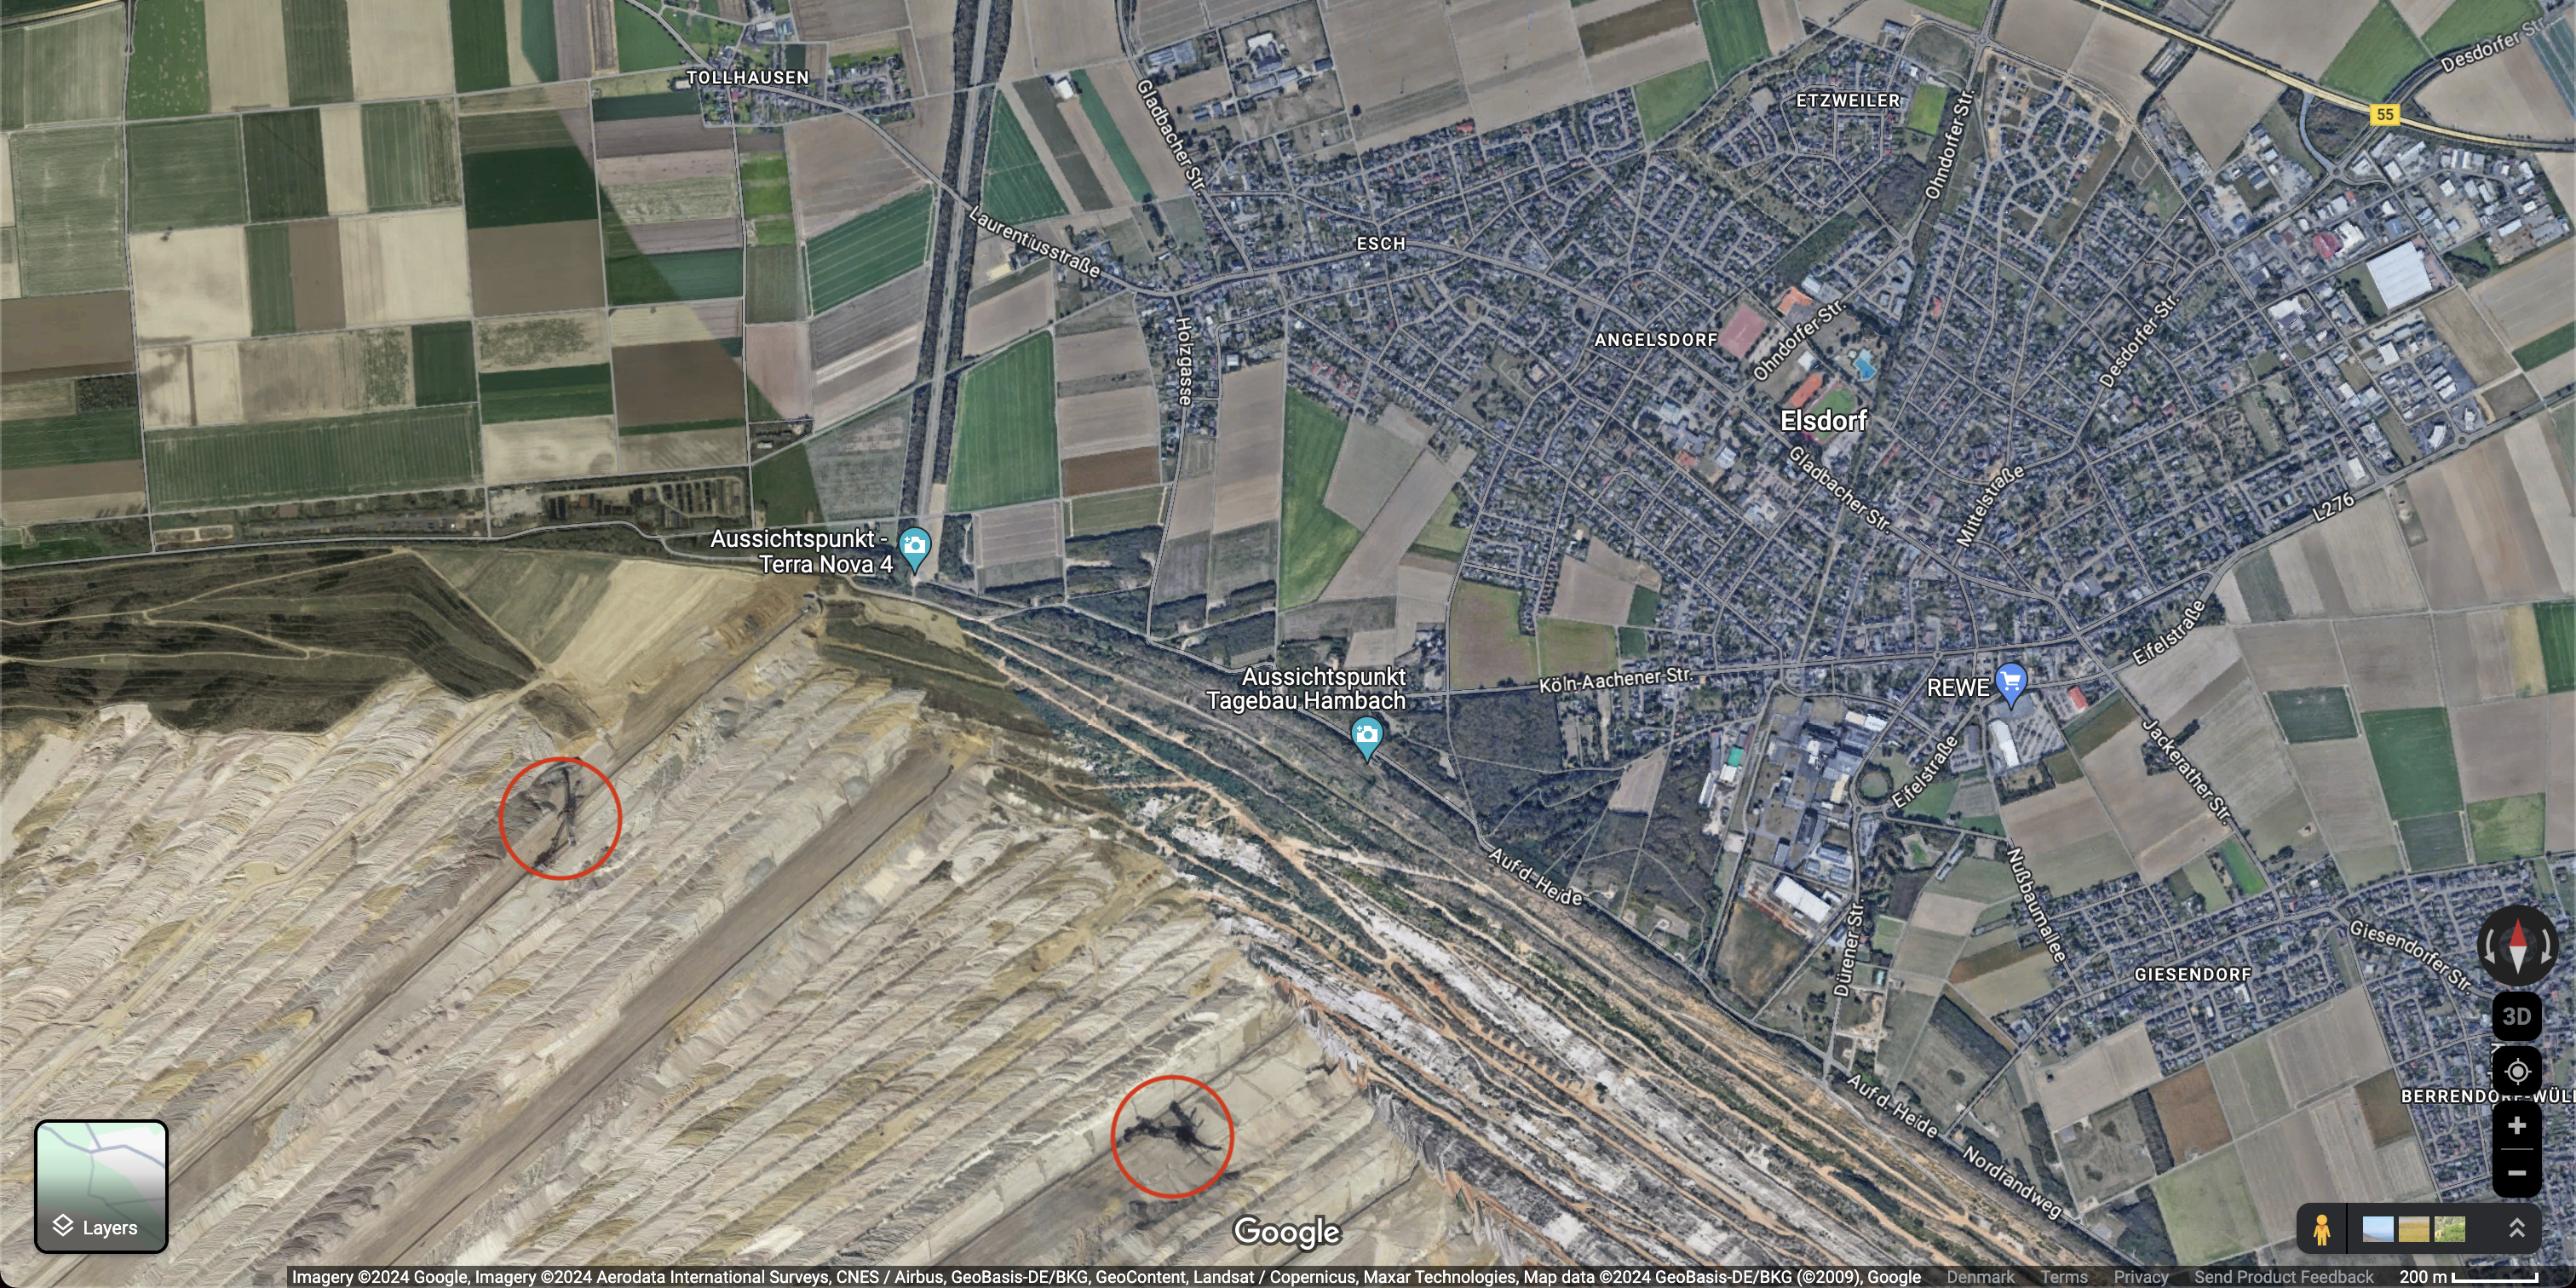
At the bottom of the pit, some machines were hard at work to remove even more material from that open wound. Far into the distance, and overhelmed by the size of the mine, these machines looked ridiculously small, as ants patiently building an anthill; Deceiving impression. These machines were Bagger 288 excavators, also known as the heaviest land vehicle in the world, weighing 13 500 tons, with a length of 220 meters. You can see on Fig. 2 a bulldozer that provides a sense of perspective.
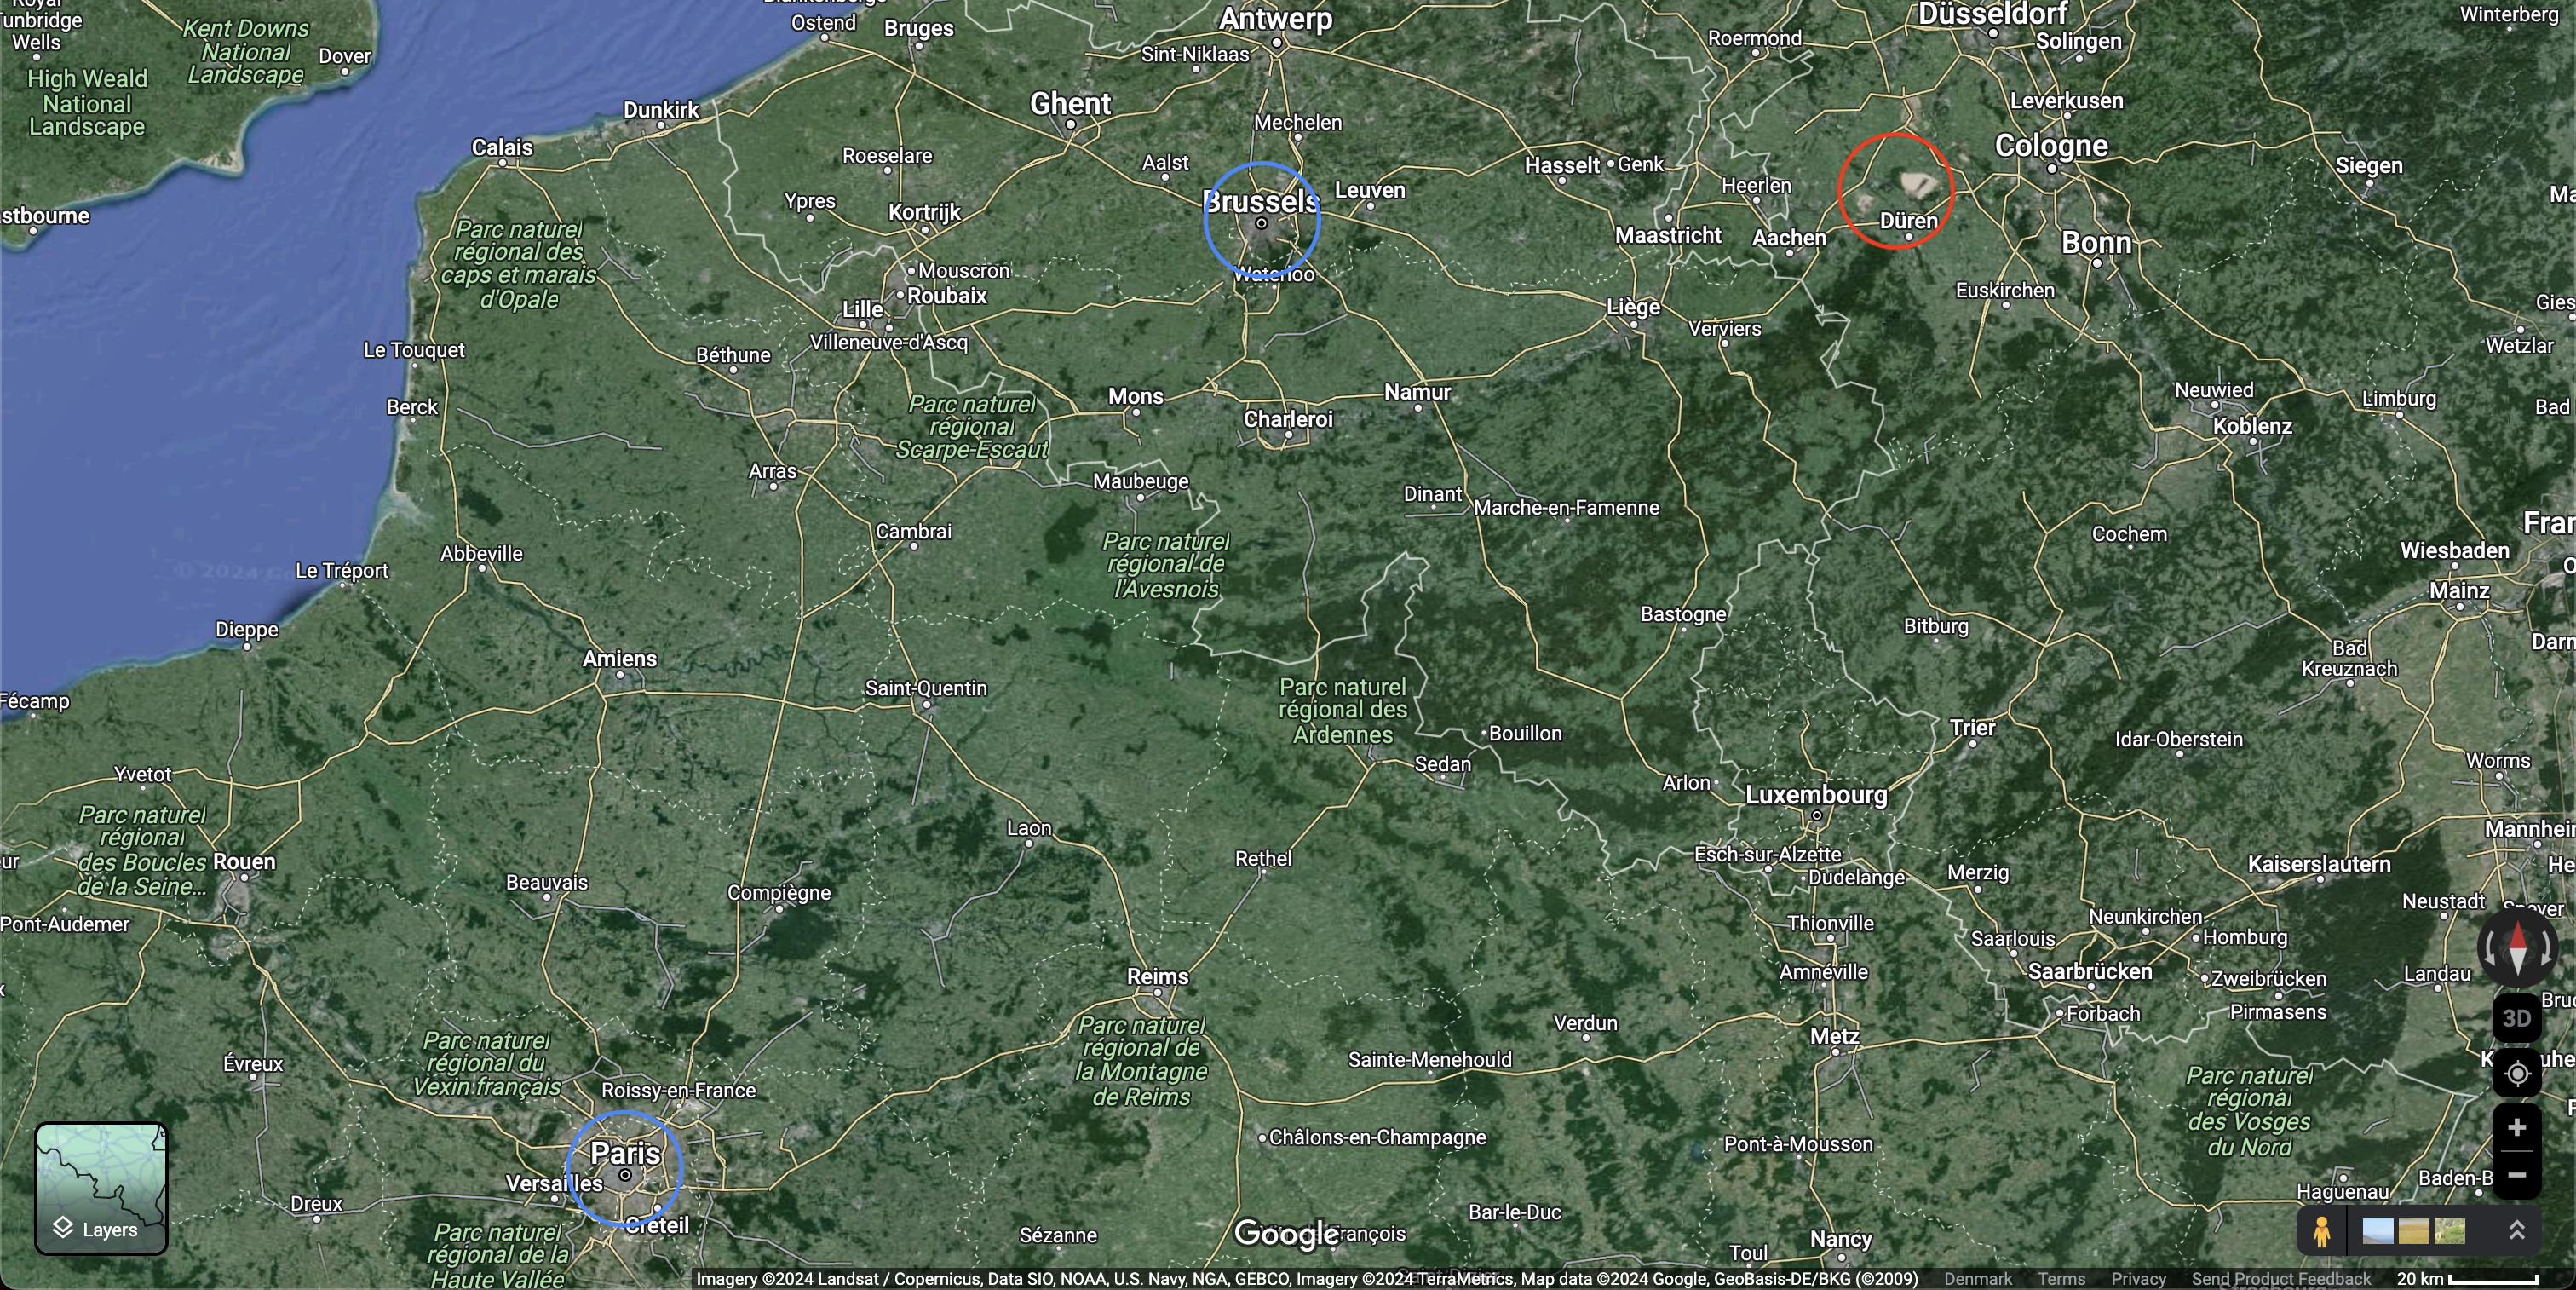
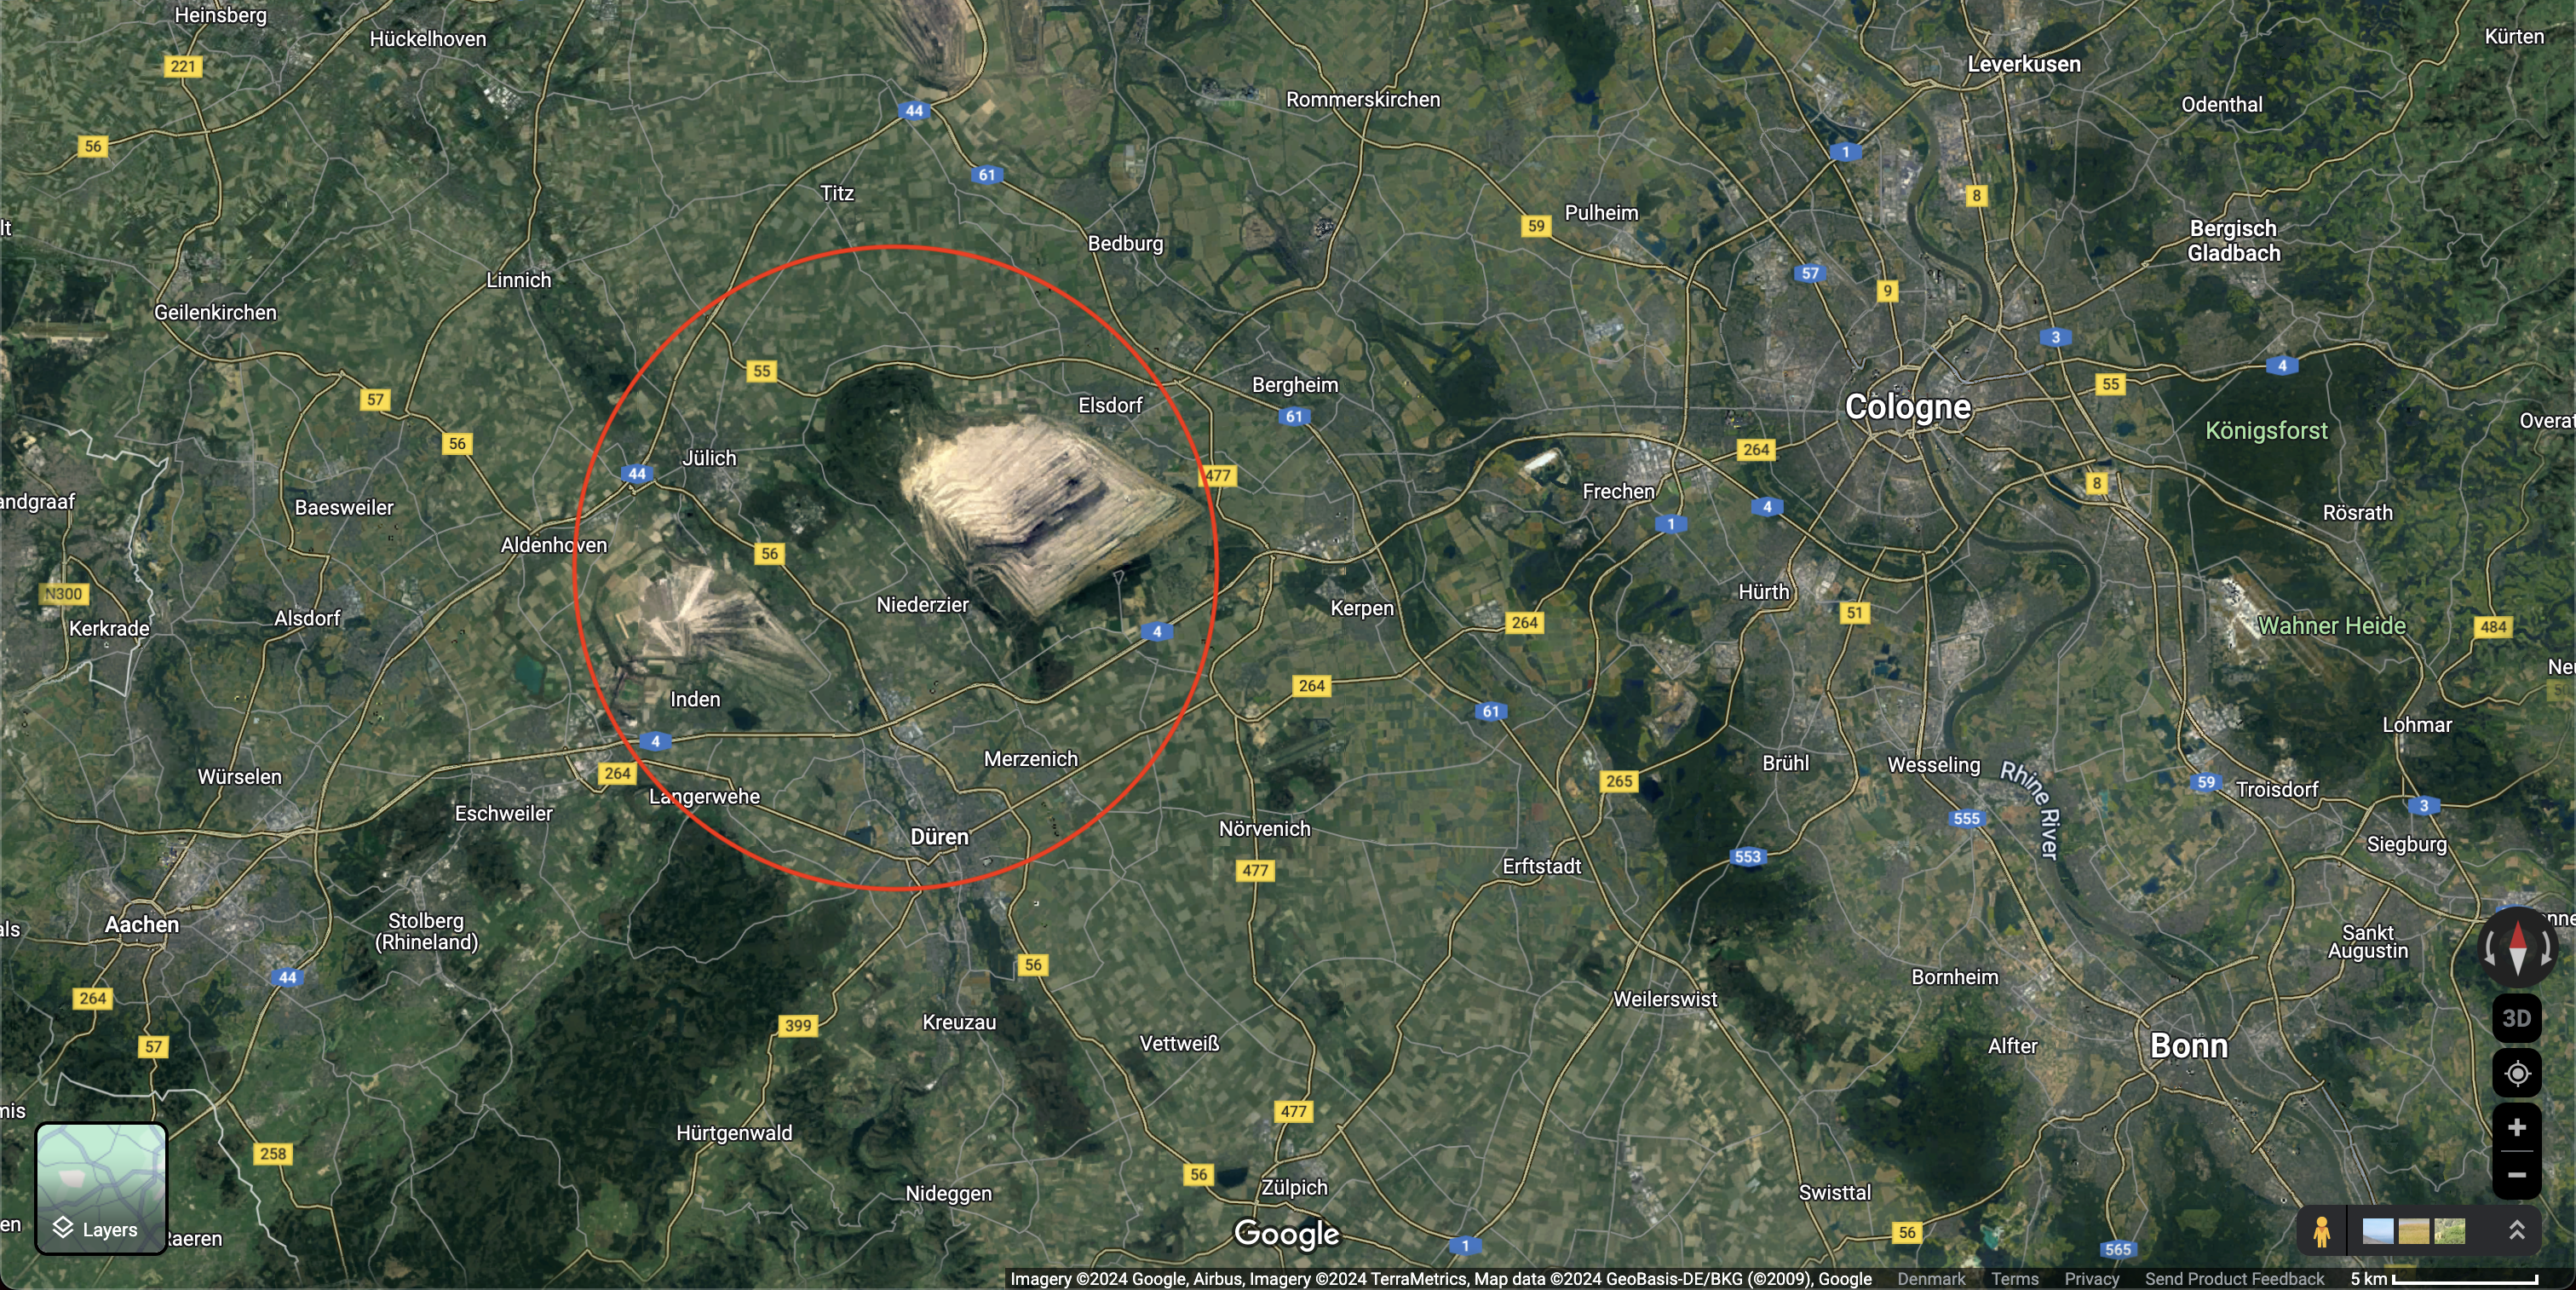
This sight left me awe-struck. For the first time I had seen the physical manifestation of our thirst for fire. All this material had been removed, burned and sublimated into our atmosphere. But even so, my understanding of how large this mine is was still off. Never would I have guessed the true scale revealed by Satellite imagery. Figure 3. is uncompromisingly revealing, the mine appears clearly visible at a scale that allows seeing cities hundreds of kilometers apart (Paris, Brussels, Düsseldorf, Frankfurt), zooming in, we can see that the mine matches in the size the entirety of the city of Cologne (4th largest German city, 1.1 million inhabitants), and finally zooming in further, we can see that the size of the coal excavators match a city block of neirghbouring town Elsdorf.
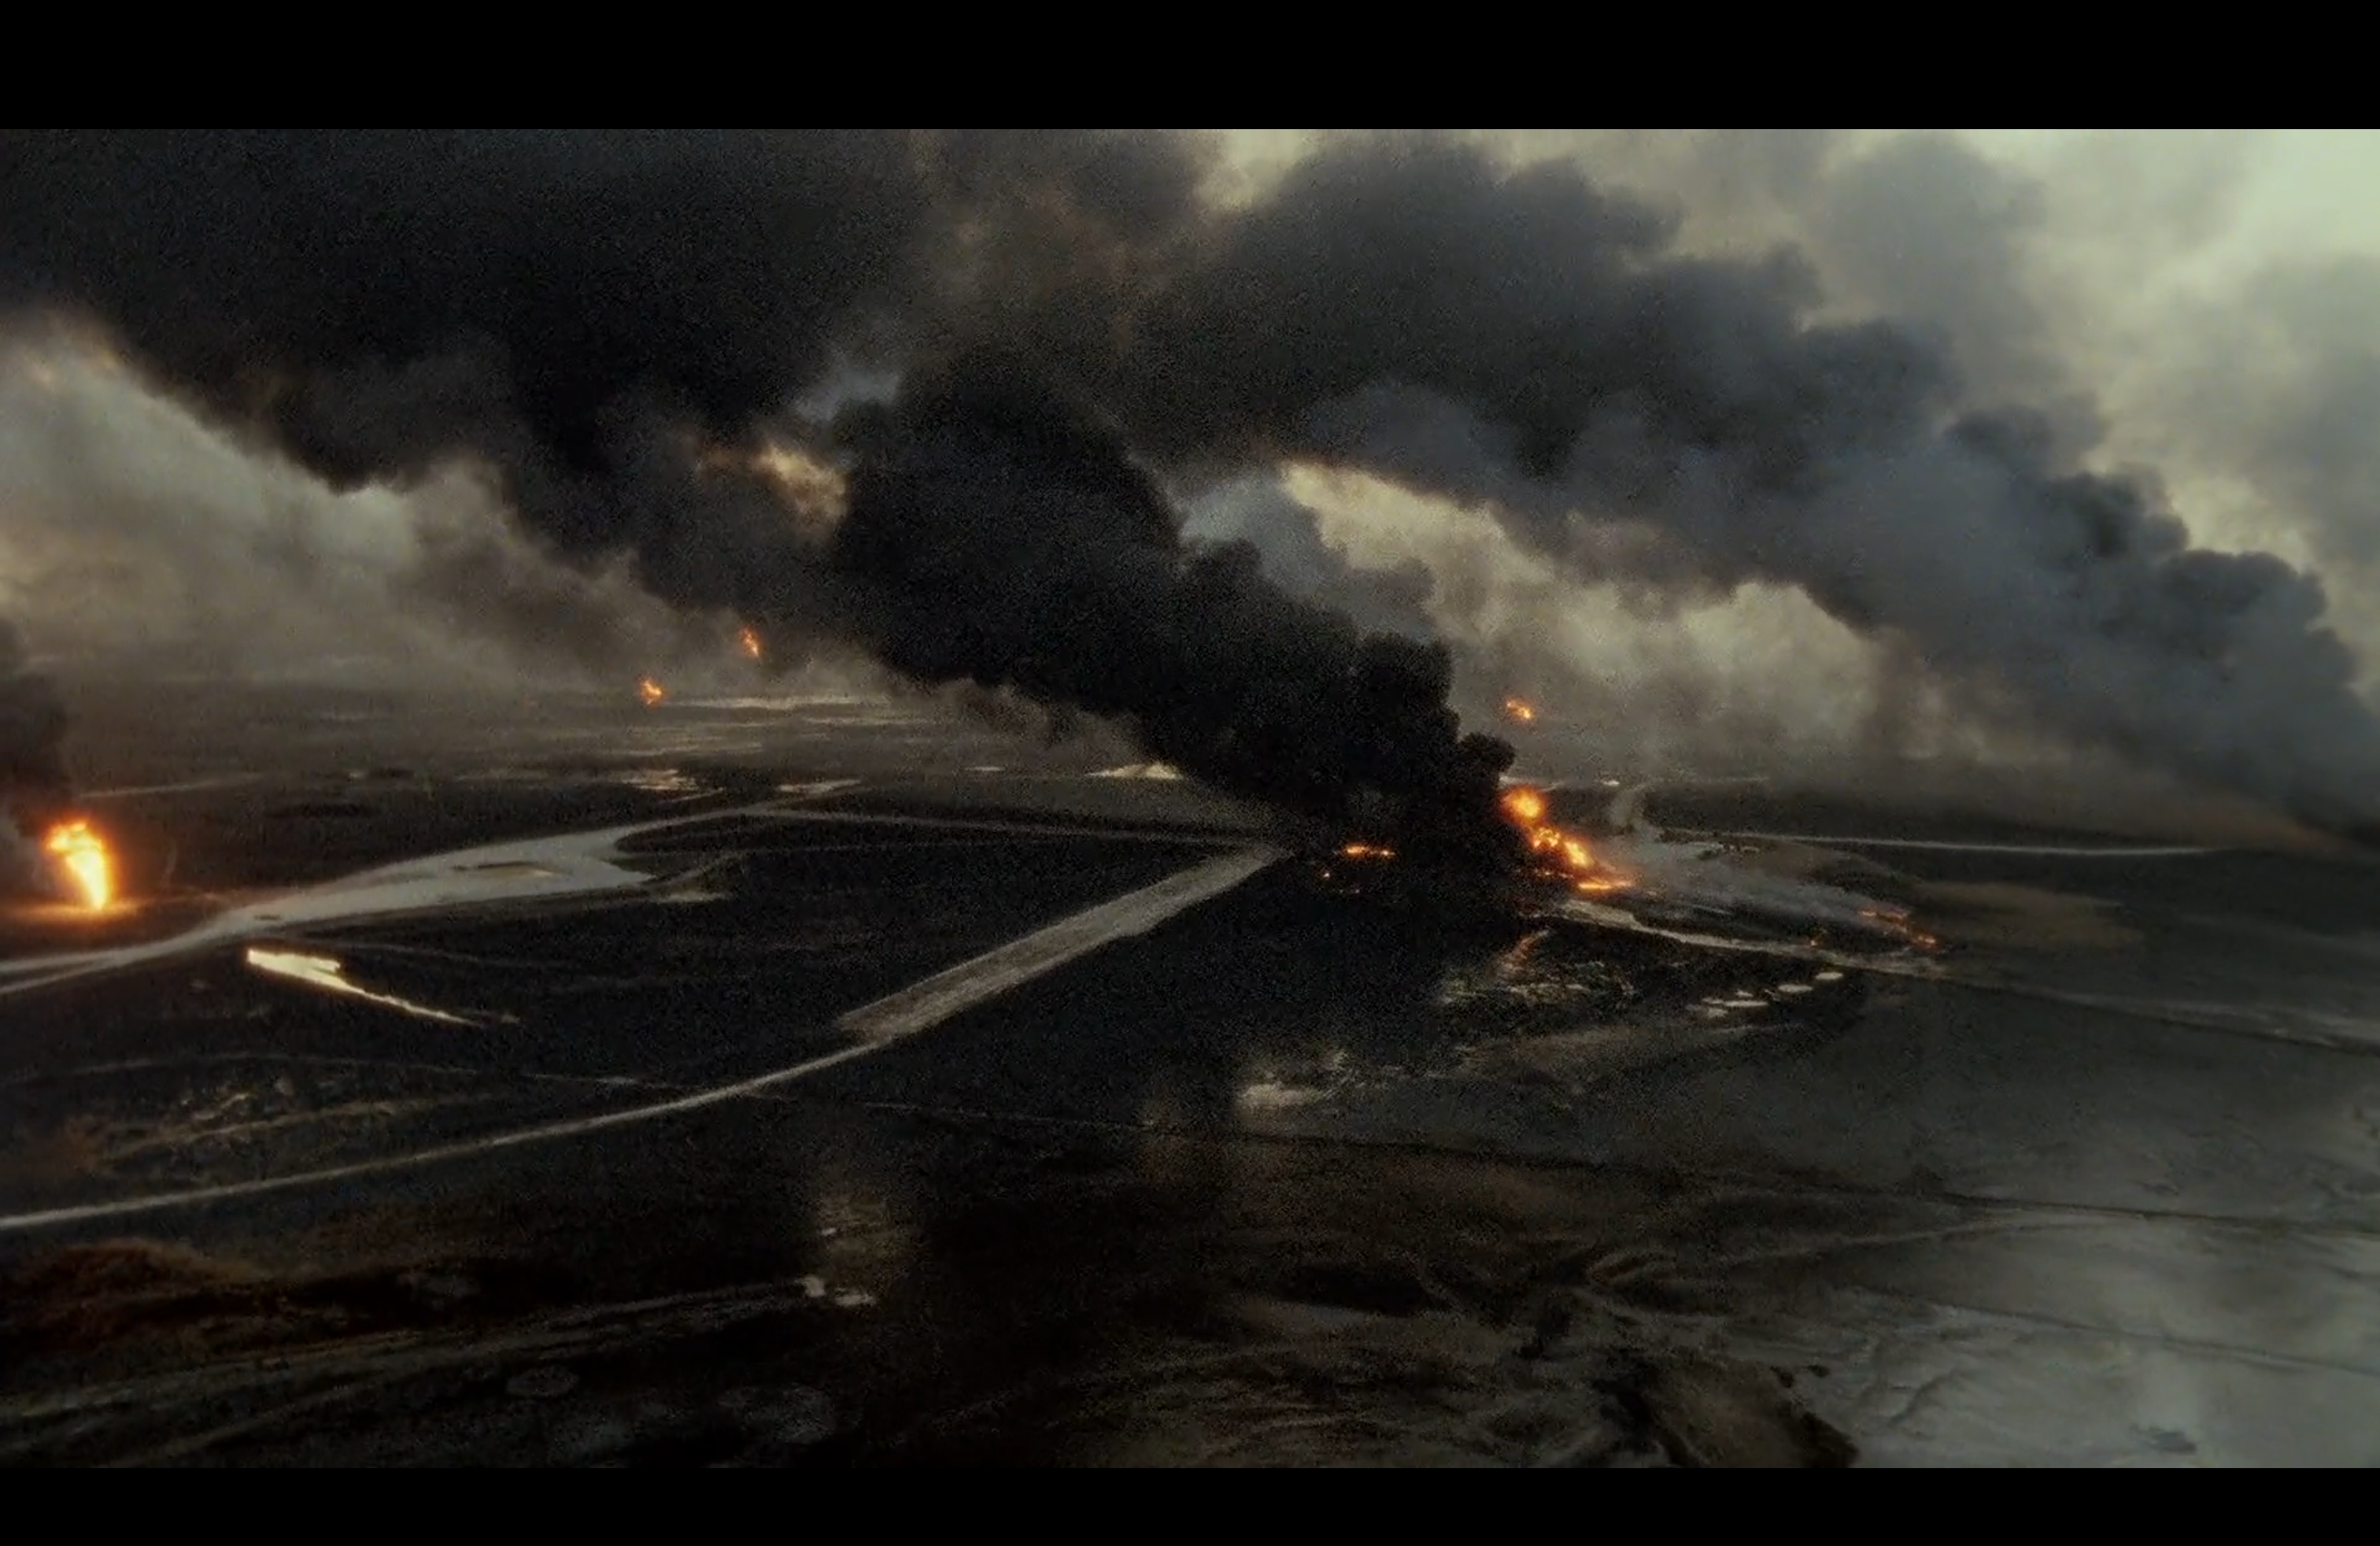
Werner Herzog’s Lessons of Darkness exposes a myriad of open shots of burning oil fields, spoutting impenetrable black clouds of soot into the air (Fig. 4), covering the desert sand in tar and ashes. In the absence of context, this hellish vision embodies how the usage of fossil fuels make humanity loose its sanity. Amongst the mouths of fire are roaming silhouettes. Texan oil workers tasked with extinguishing the fires, but as they succeed, one of them casts a torch back into the stream of oil, lighting it back on fire. “Has life without fire become unbearable for them?” asks Herzog.
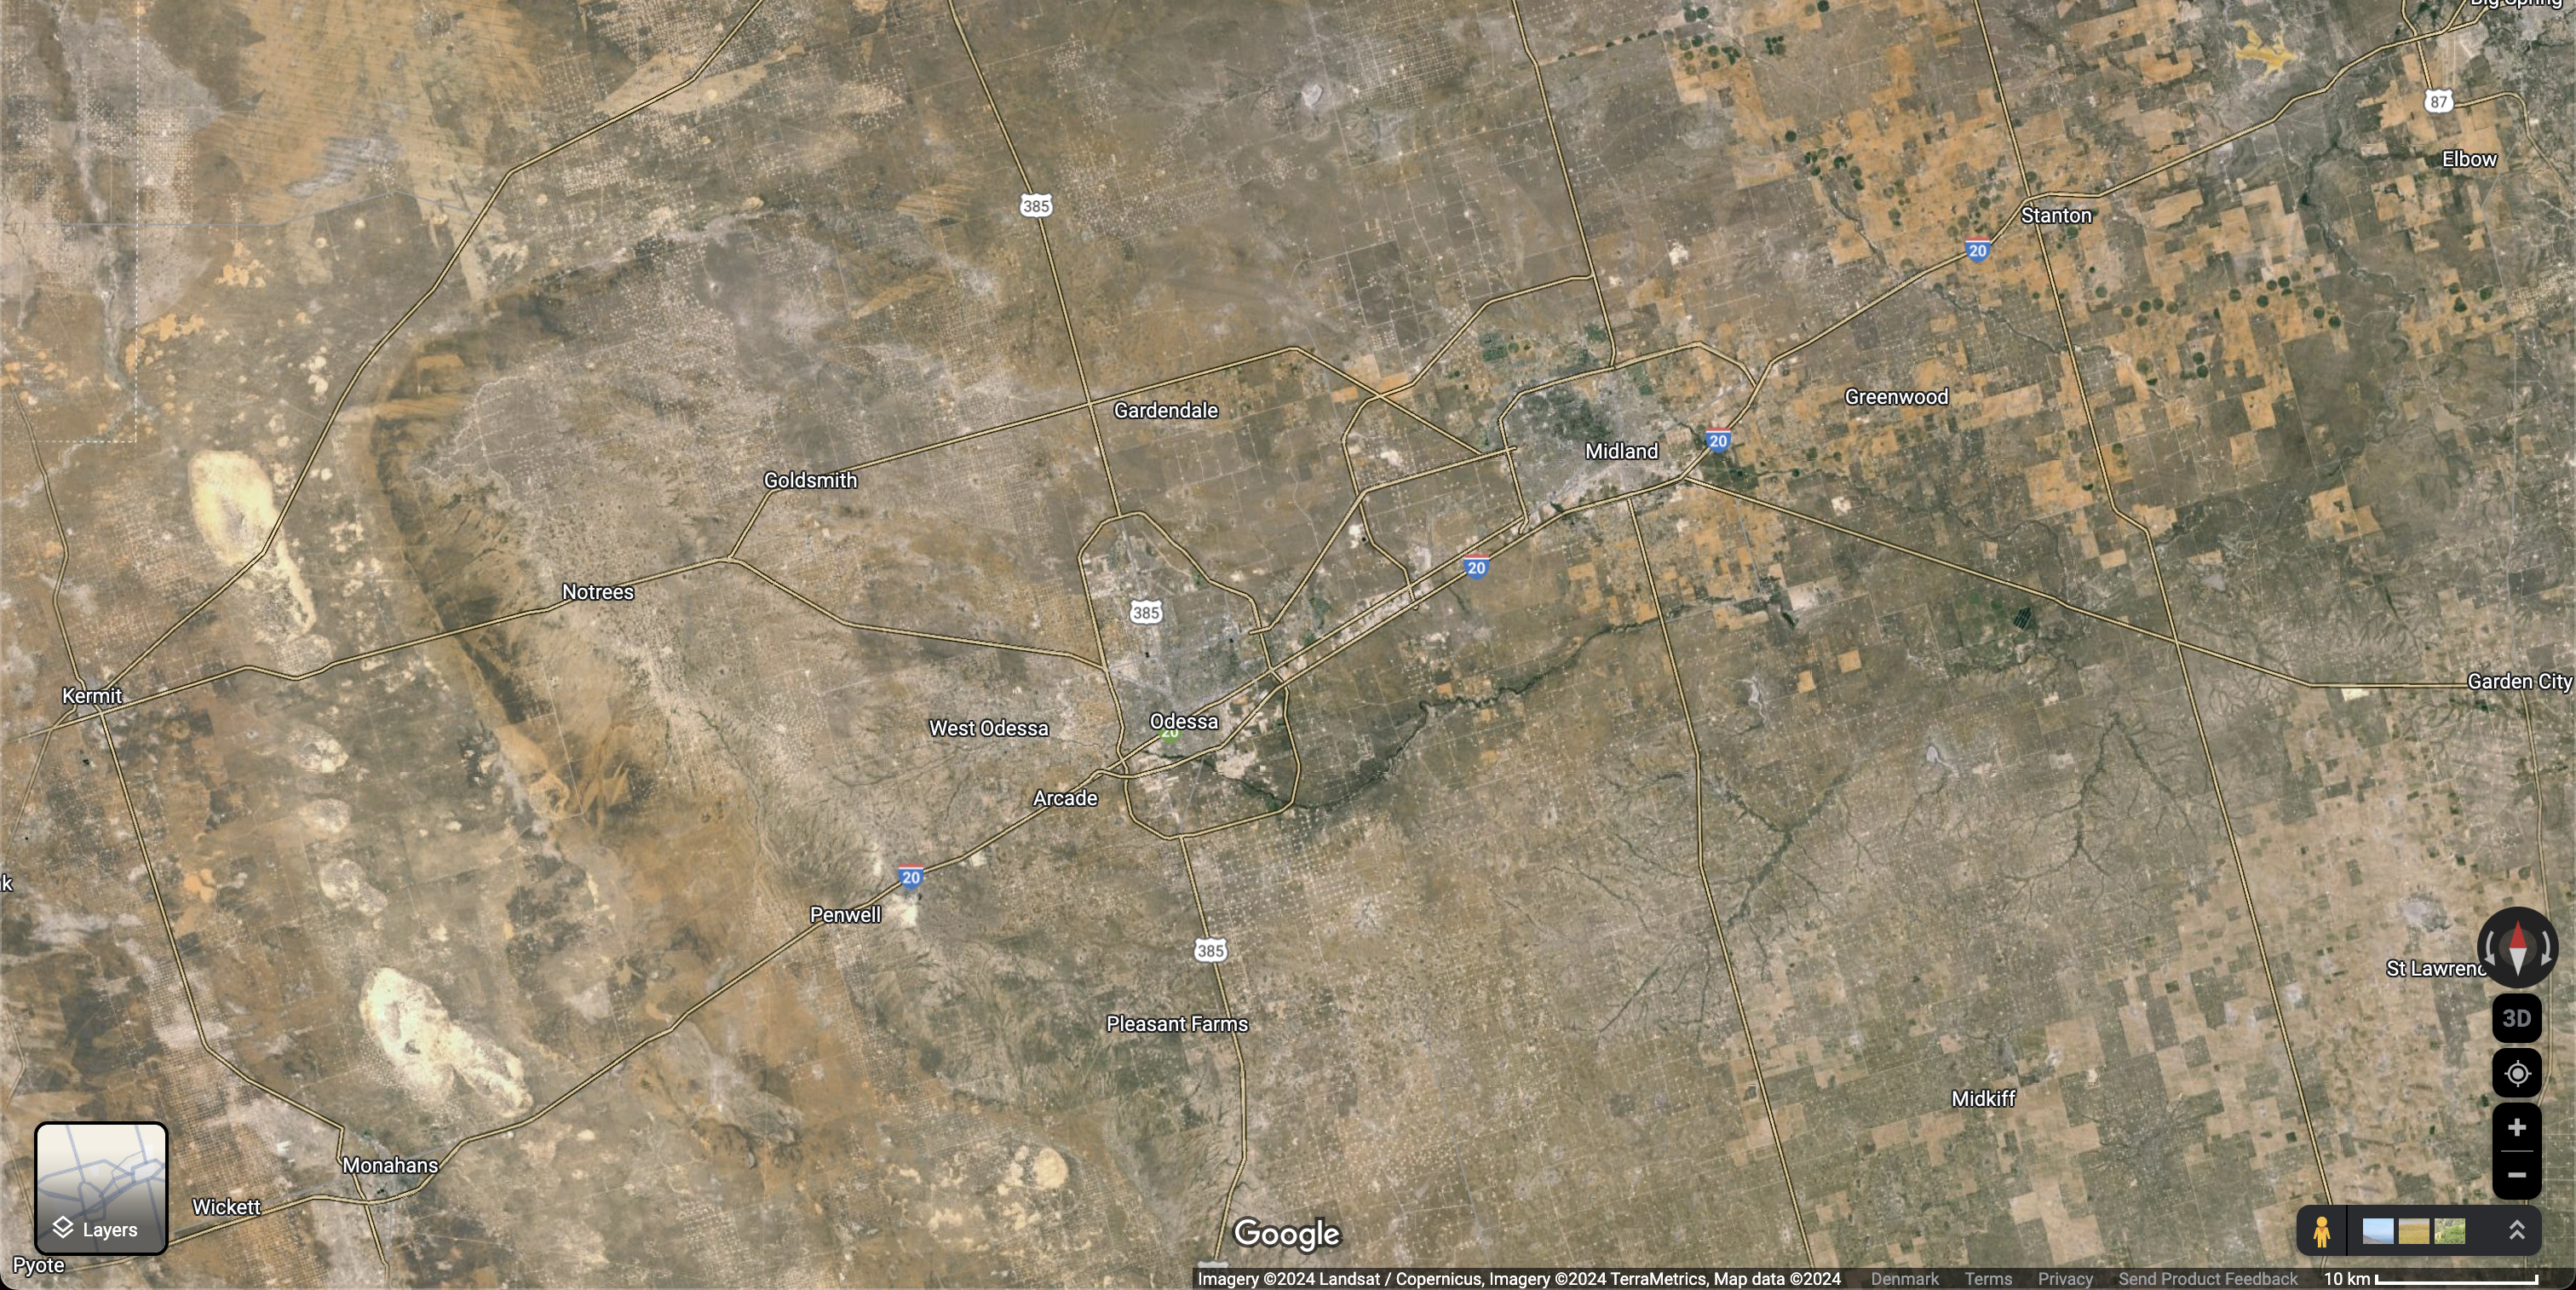
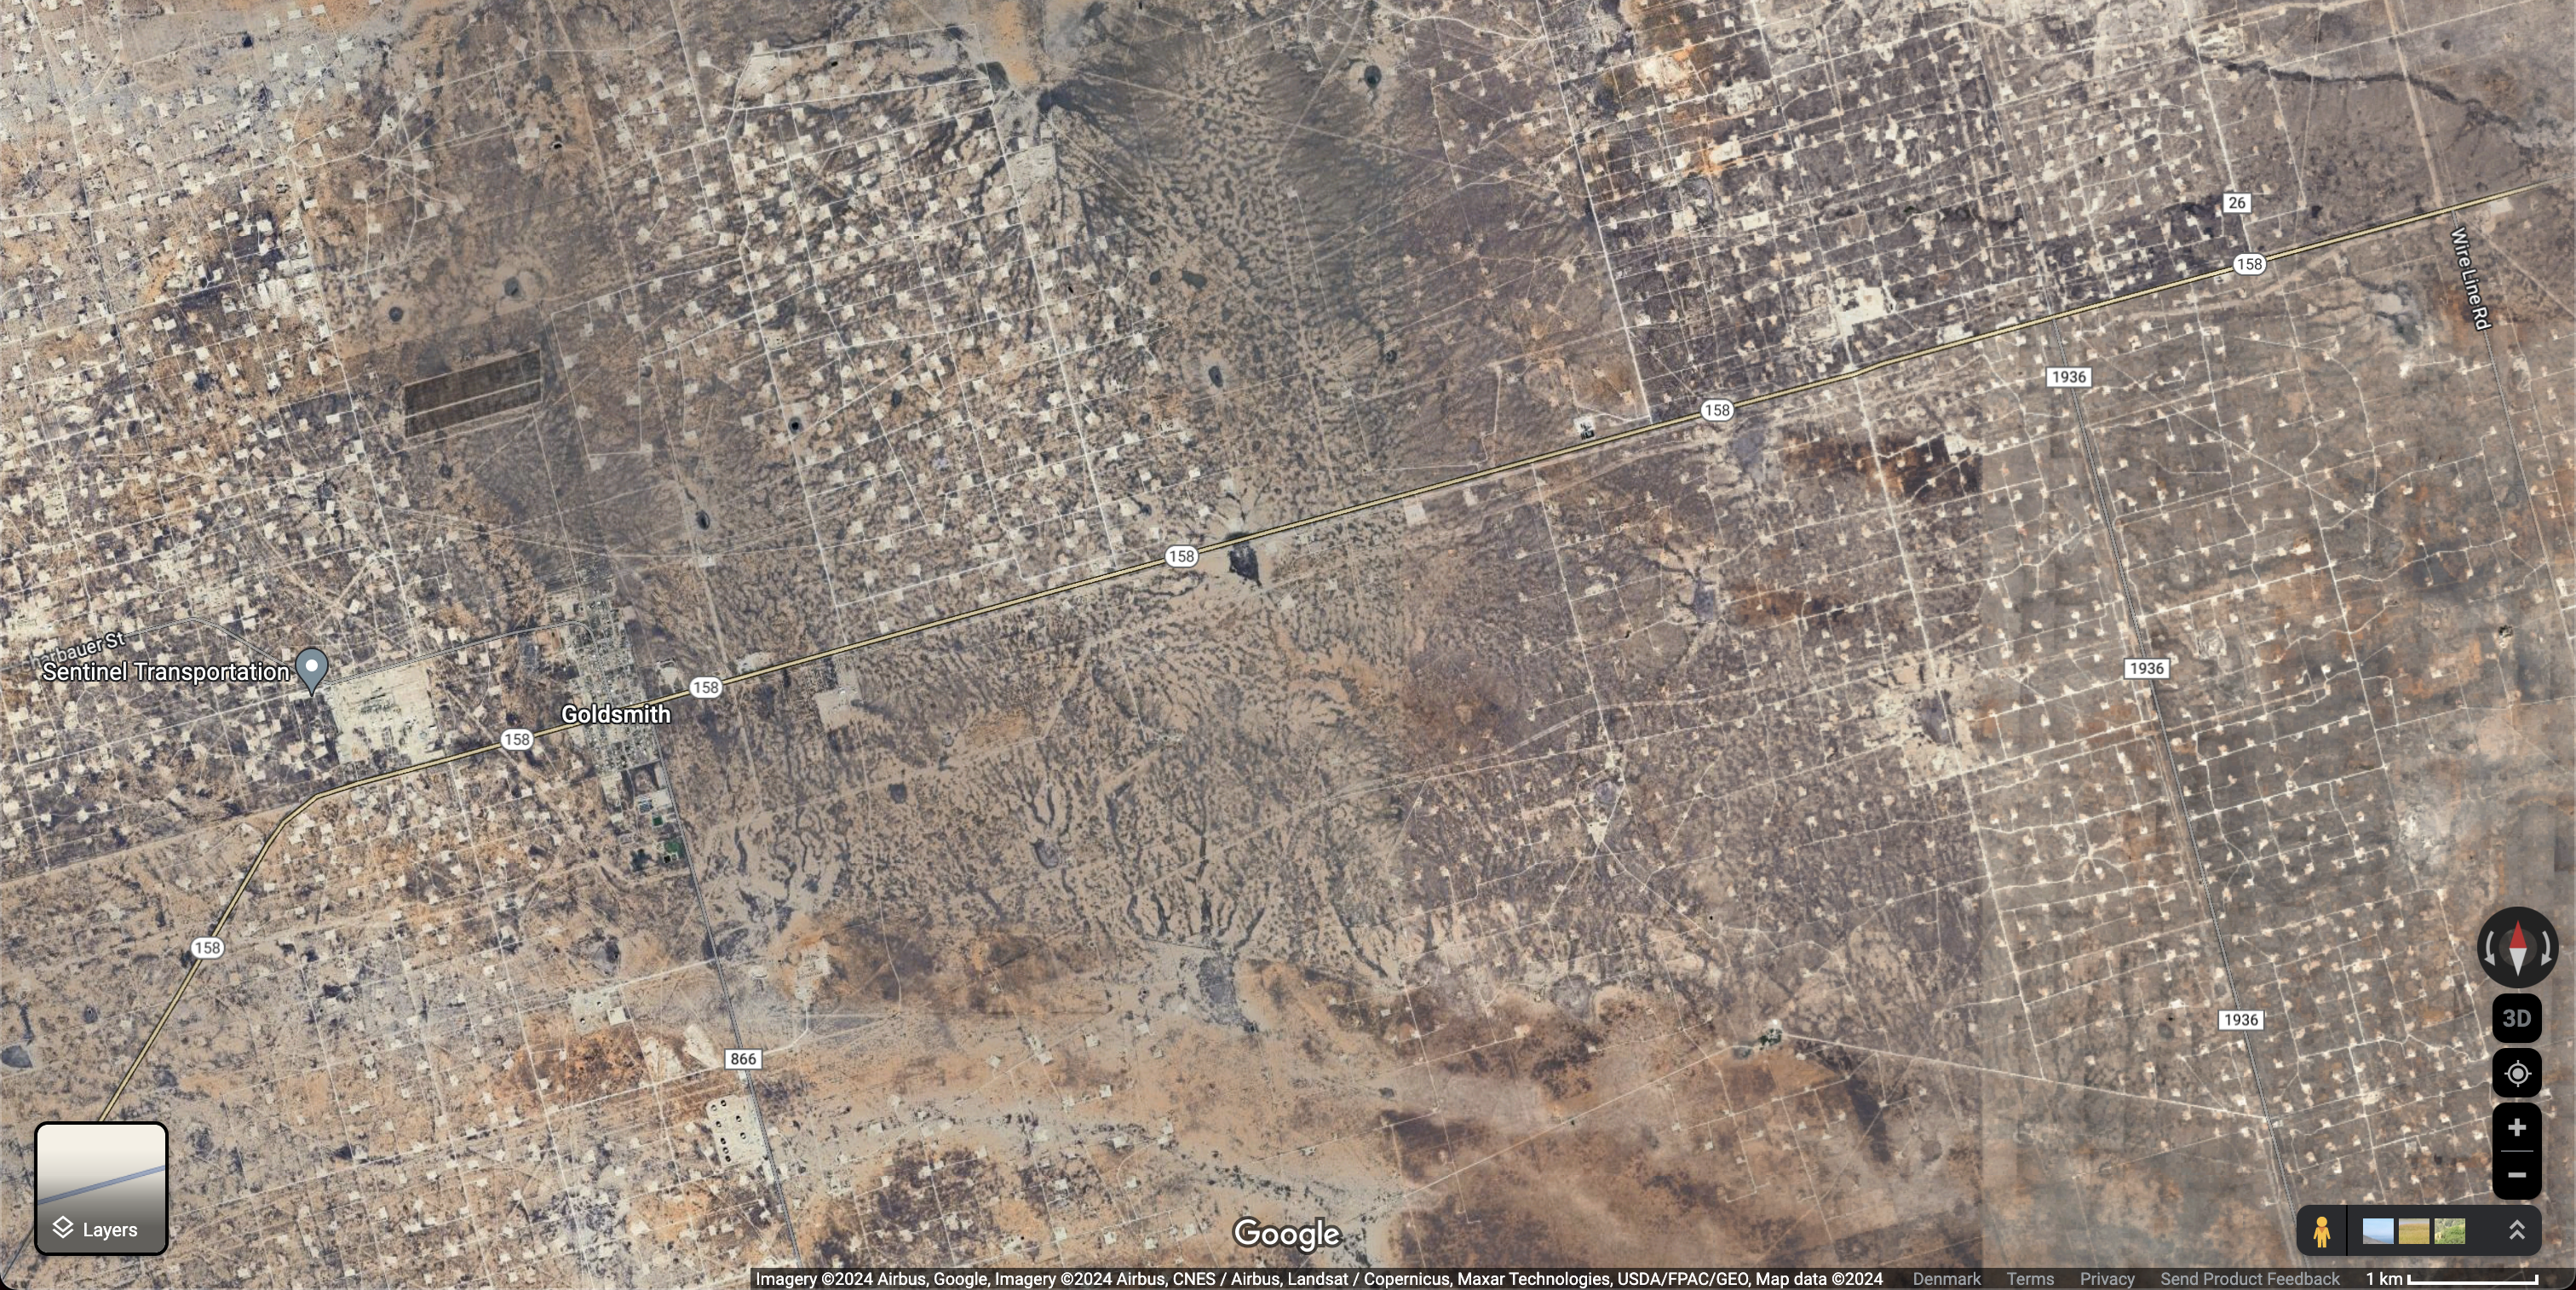
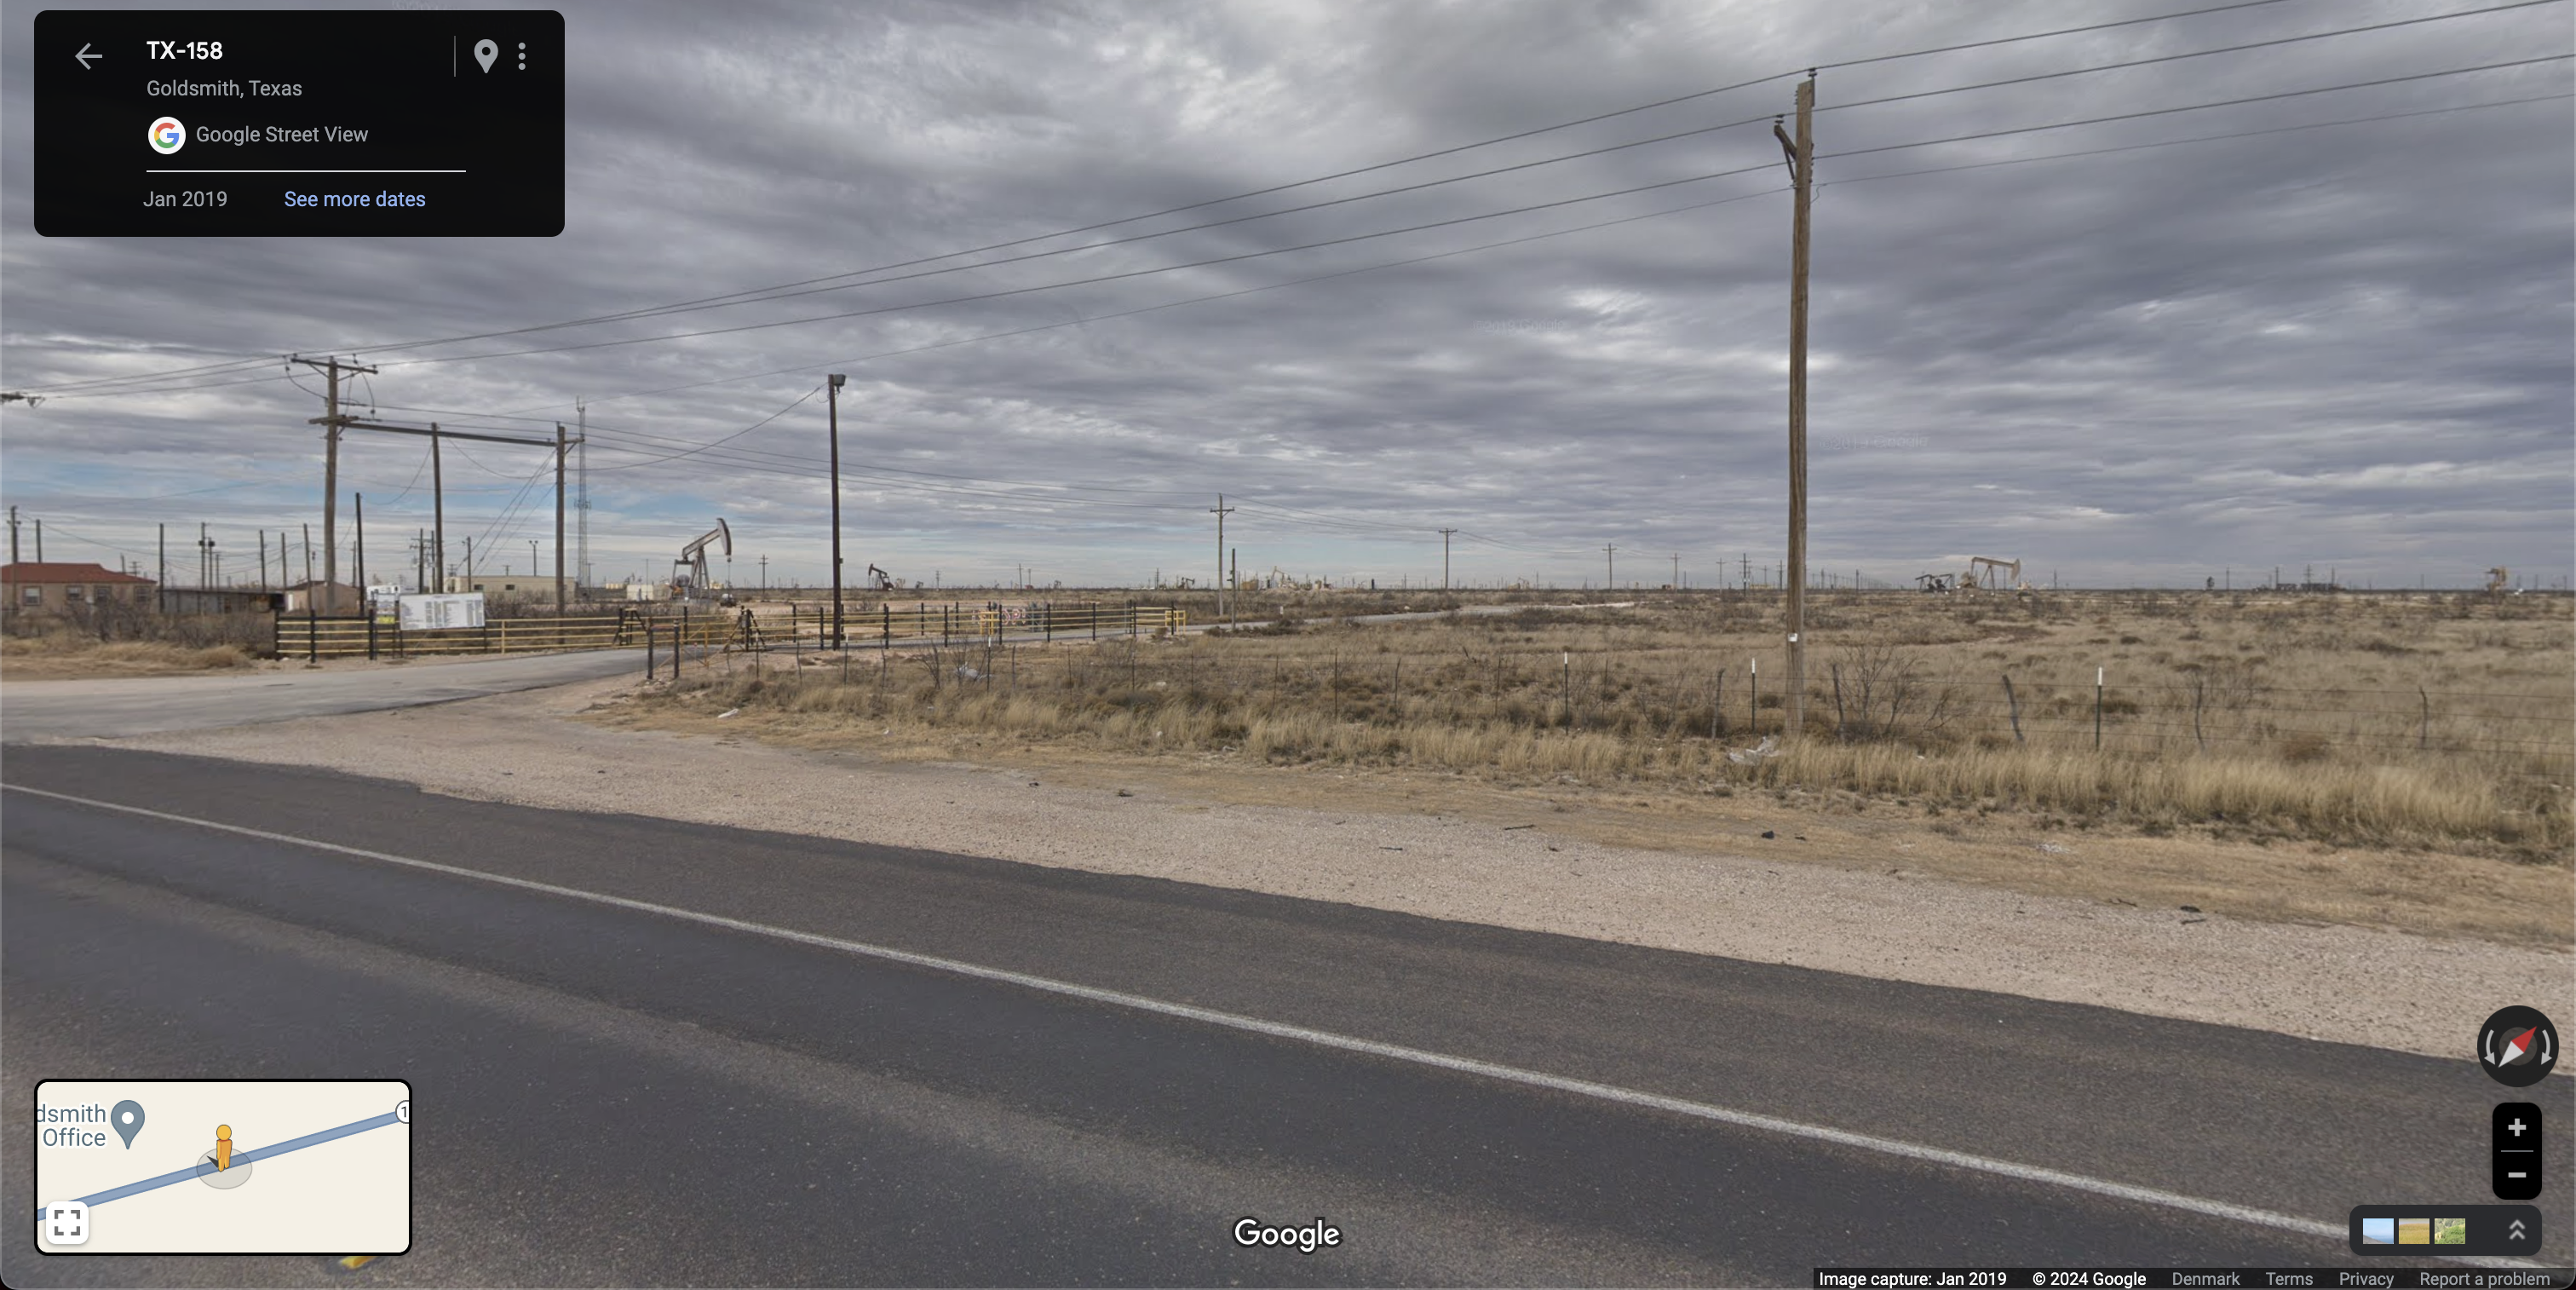
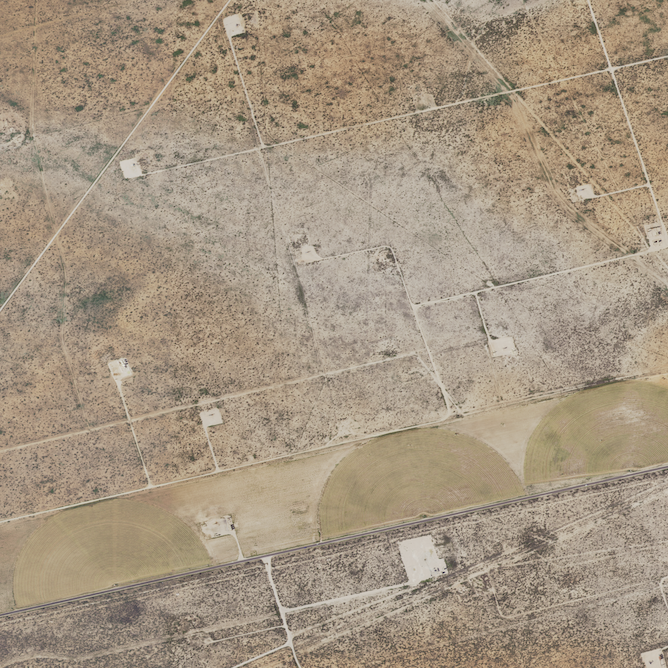
For days after seeing this movie, that vision stuck with me. I was shaken to witness that oil fields in that region of Kuweit were so numerous that lighting them on fire would recreate our age-old vision of hell on earth. I couldn’t help but wonder - how many oil fields are there? I knew Kuweit as an expectionally oil-rich country, and was thus lead to wonder if that vision of nightmare could have happened in other places. It could have, tells us satellite imagery, many times over. My first exploration of the desolate plains of the Permian Basin (Western Texas, Figure 4.) through Google Maps clearly marked the second occasion in which the scale of our usage of fossil fuels imbued me. For hundreds of kilometers on end, the satellite images seem to be corrupted by a silicon-like pattern of white segments and squares. A closer look unveils the nature of that phenomenon. The systematic and overwhelming covering of the bare land in a digital, articulated and orderly network is the result of the deliberate covering of the geological deposit by an unfathomable number of oil fields, systematically laid down to maxime the extraction rate of the oil resting underneath.
That vision left a lasting impression on me. Captivated by this vision of a landscape simultaneously cursed and blessed, I wanted to use readily available tools to rationalise it. Can we train a computer vision model to detect and count all of these oil fields? Can it help us cristallise that subjective impression, was I left to wonder.
Counting all the oil fields within the Permian Basin
Building and training a model to identify oil wells from satellite images
Luckily for me, I was not the first one who thought about training a machine learning model to detect oil fields from the growing body of available satellite imagery. This idea would actually have been short lived if no labeled dataset of oil derricks was available; on my own, trying to get a precise answer to this absurd question would have required too large an investment to carry on.
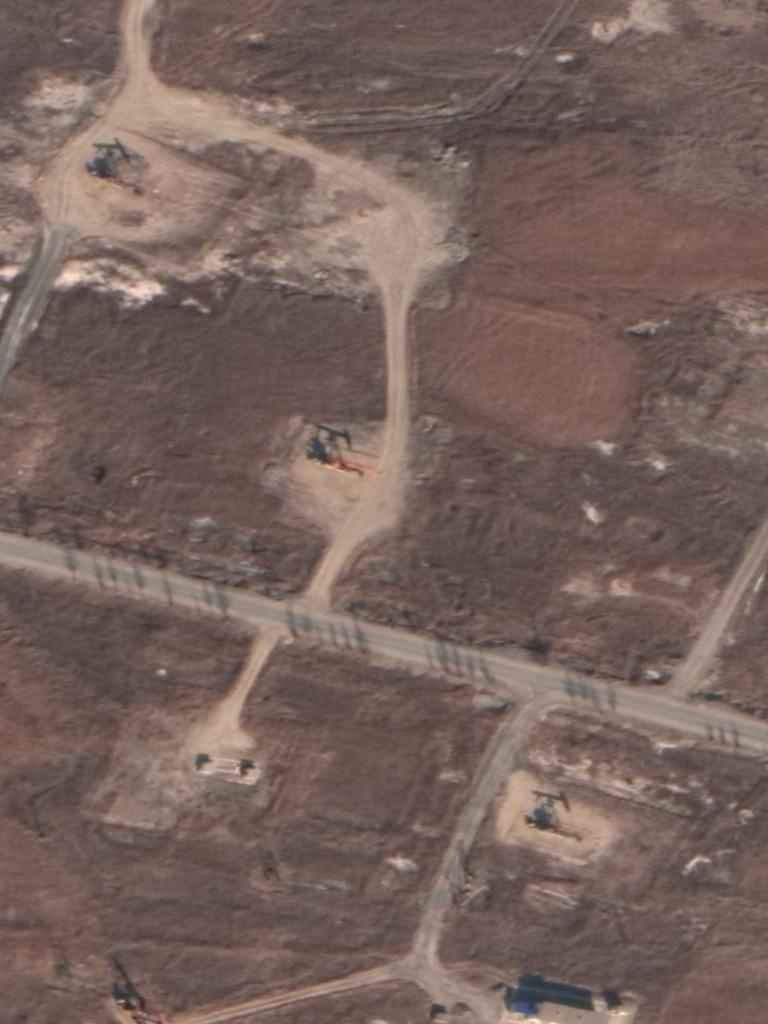
In 2021, Z. Wang et al published a paper called “An Oil Well Dataset Derived from Satellite‐Based Remote Sensing” [1] sharing their foundational work on assembling as large a dataset as possible of labeled satellite images from Daqing City in China, called Northeast Petroleum University–Oil Well Object Detection Version 1.0 (NEPU–OWOD V1.0). In all, they were able to gather 432 images containing a total of 1192 identified oil wells, which are available publicly.
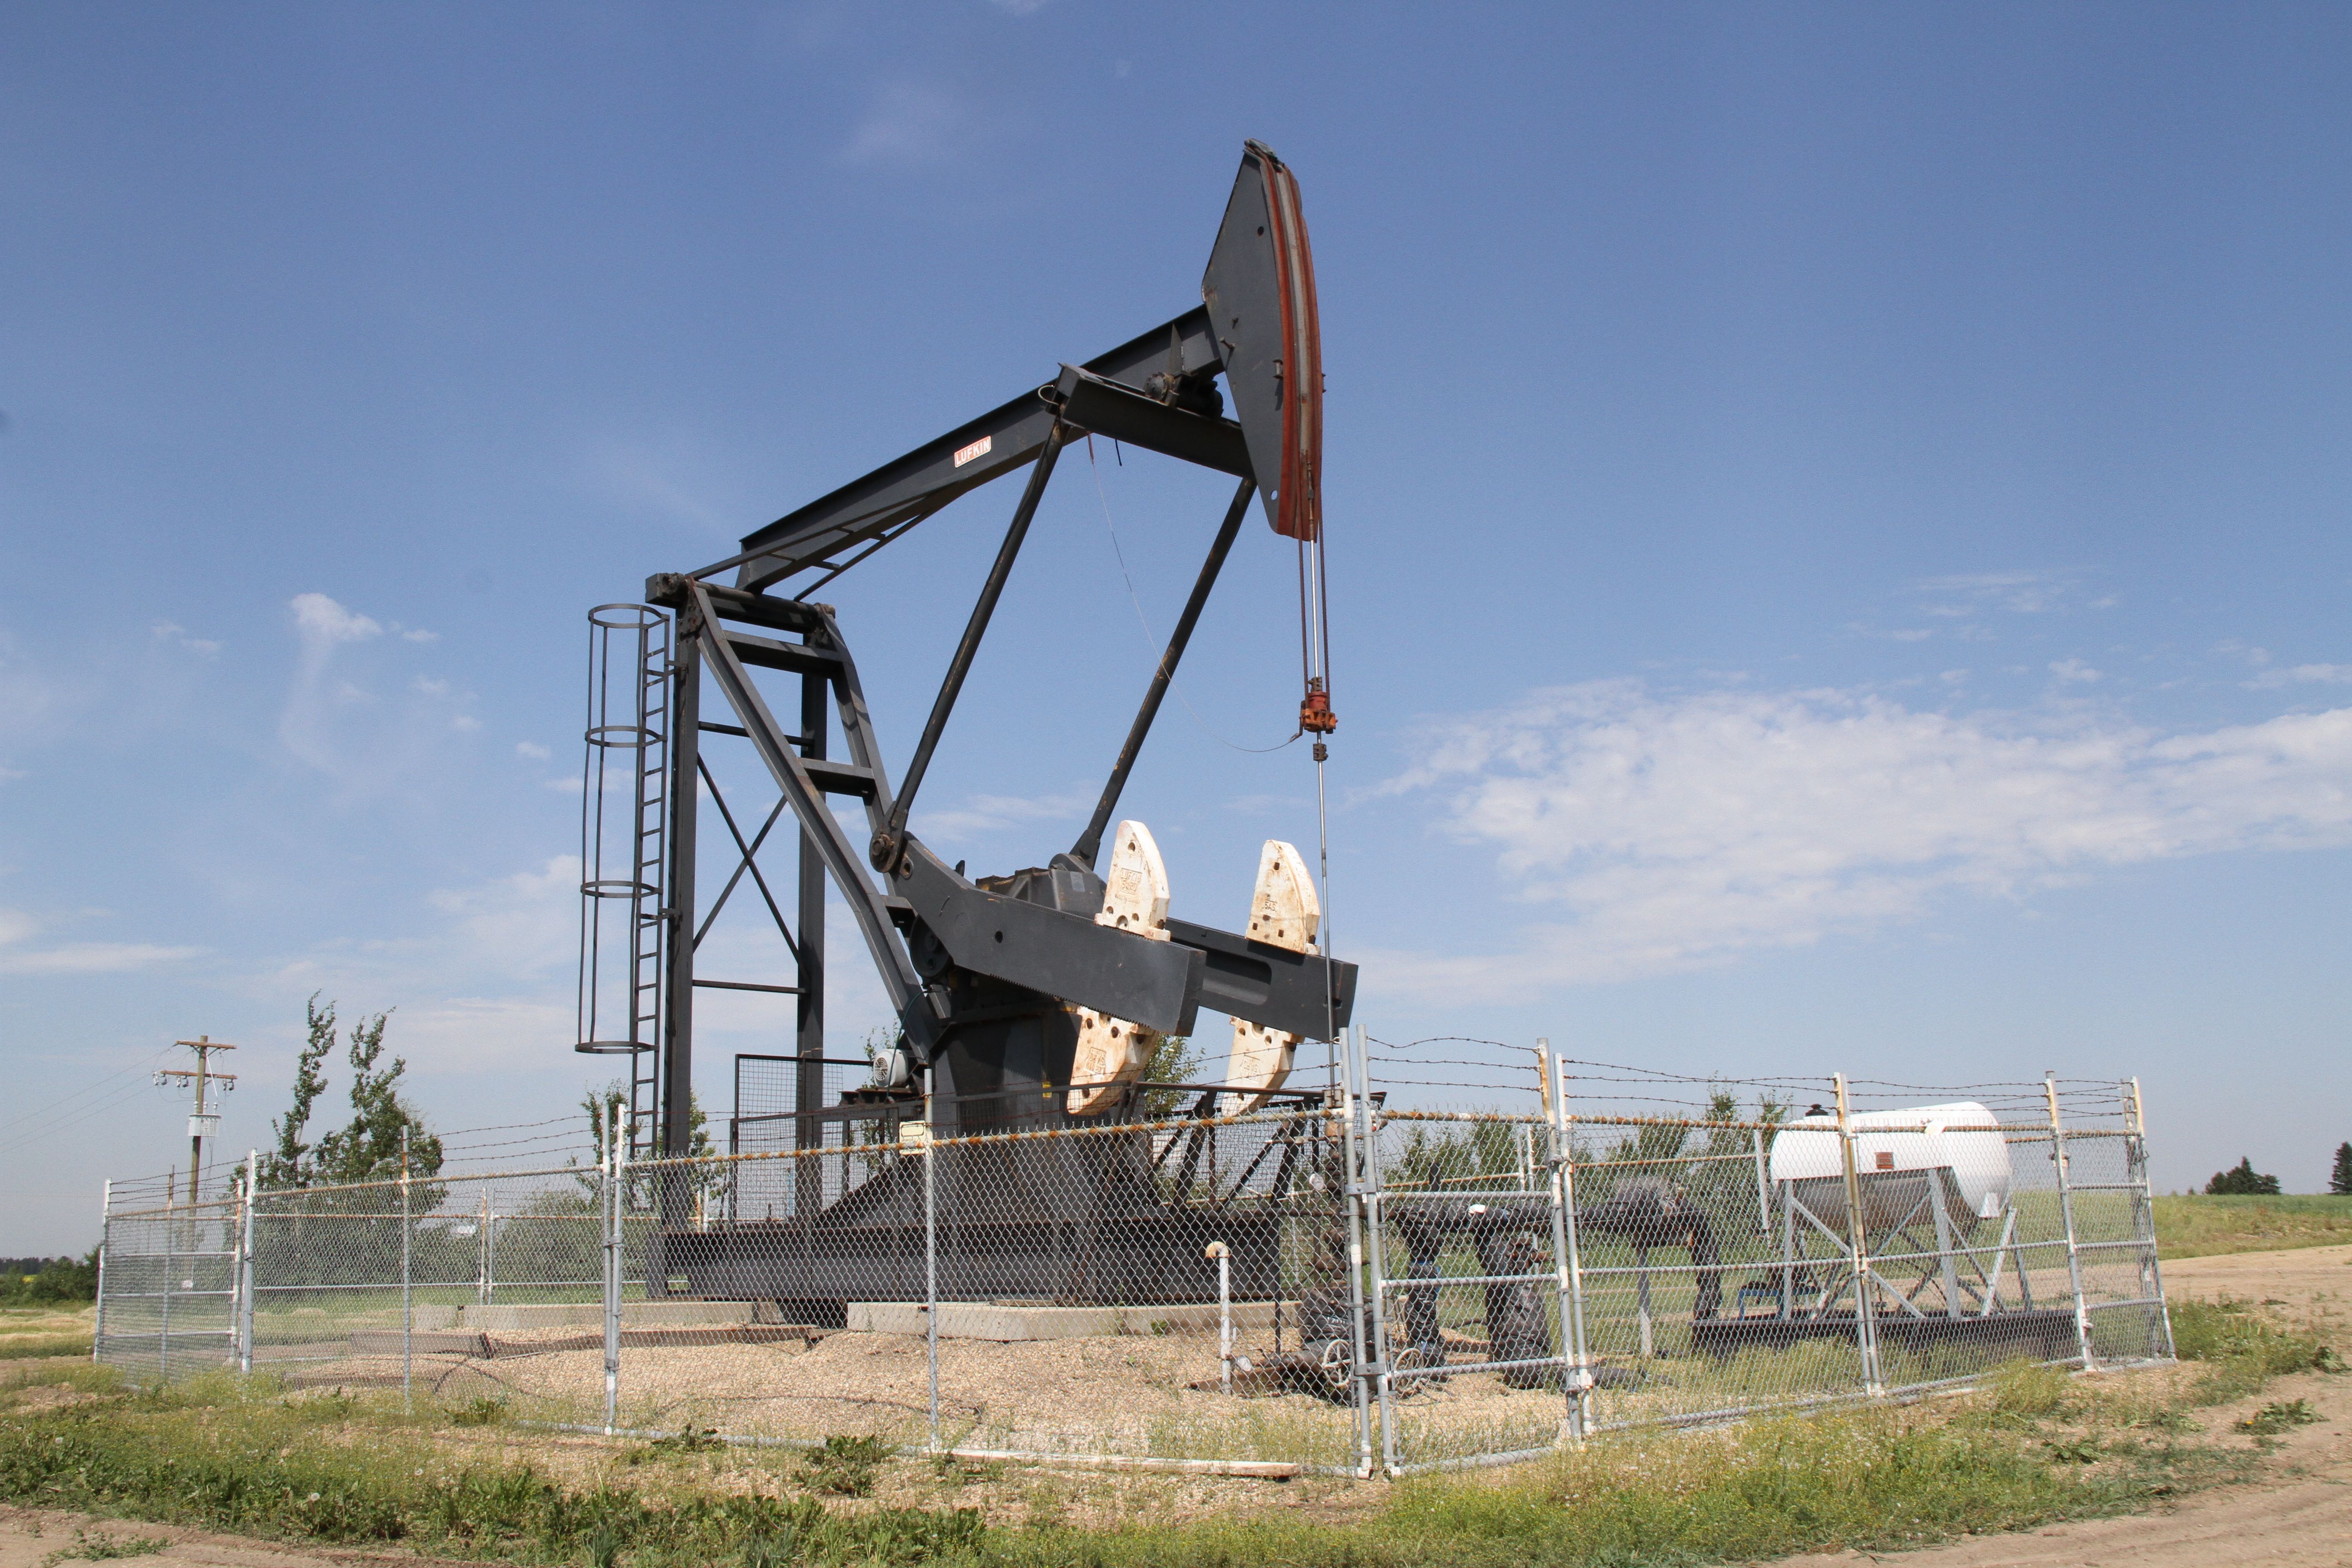
Specifically, the oil wells are identified thanks to the above ground infrastructure, with the distinctive pumpjack appearing clearly on most images. Pumpjacks are quite ubiquitous for onshore oil wells [3]. They are a quintessential design for the pump required to bring the oil from the underground reservoir to the surface. As a result, the aspect of the pumpjacks present in the NEPU dataset resembles rather closely their American counterparts, providing hope for being able to transfer learning from the NEPU dataset to satellite images mapping the Texan soil. Their aspect is distinctive, with clear-cut features like the shape of the hammer, and sizes ranging 6-12 meters long, 2-5 meters wide and 5-12 meters high, which make their detection possible from space. Typical resolution for satellite images ranges from 0.30 meters (Pleiades Neo) to 10 meters (Landsat).
The organisation of the dataset is clear enough to investigate directly models for identifying the shape of the pump jacks within the different satellite images. Each image is bundled with a metadata file containing the coordinates (x,y) pixel-wise of areas containing all pump jacks.
YoloV5
Ultralytics’ YOLOv5 is a plug and play solution for object detection (Note: they have since released YOLO11, which is a more recent version of the same model). My objective here was not to revolutionise the field of object detection, but rather to use a pre-existing solution that is relatively performant, easy to use, and can scale to my use case. I suspected that gathering the right dataset to cover the Texan oil fields would be complex enough not to want to get in the weeds of object detection modelling. YoloV5 allows in this case, once the NEPU dataset has been made compatible, to train a model shortly thereafter.
Turning the NEPU dataset into a format compatible with YOLOv5 is relatively straightforward, and is mostly a matter of reorganising information about the images and labeled oil wells within the dataset. The following Google Colab notebook provides all the code necessary to do so.
Once the dataset has been reformatted, multiple options are possible for fine tuning a YOLOv5 model to detect oil wells.
Local training (not recommended)
To execute training locally, one can compress the dataset generated above and upload it to a public storage (ex: Cloud Storage, as specified in the download field below). You then need to clone the YOLOv5 repository locally, and add the following configuration, under data/NEPU.yaml, to provide the YOLOv5 model all information necessary to download and preprocess the dataset, to then kickstart a local fine tuning.
# YOLOv5 🚀 by Ultralytics, AGPL-3.0 license
# NEPU dataset - NEPU-OWOD V1.0 (Northeast Petroleum University—Oil Well Object Detection V1.0)
# https://drive.google.com/drive/folders/1bGOAcASCPGKKkyrBDLXK9rx_cekd7a2u
# Example usage: python train.py --data NEPU.yaml
# parent
# ├── yolov5
# └── datasets
#     └── NEPU

# Train/val/test sets as 1) dir: path/to/imgs, 2) file: path/to/imgs.txt, or 3) list: [path/to/imgs1, path/to/imgs2, ..]
path: ../datasets/NEPU # dataset root dir
train: images/train # train images (relative to 'path')
val: images/val # val images (relative to 'path')
test: images/test # test images (optional)

# Classes
names:
  0: oil well

nc: 1

# Download script/URL (optional)
download: https://storage.googleapis.com/prometheus-pride-public/NEPU.zip
Running the following script is then enough to start training.
python train.py --data NEPU.yaml --epochs 300 --weights '' --cfg yolov5n.yaml  --batch-size 128
                                                                 yolov5s                    64
                                                                 yolov5m                    40
                                                                 yolov5l                    24
                                                                 yolov5x                    16
ClearML (recommended solution)
All documentation to run YOLOv5 trainings with ClearML can be found here
ClearML provides a way to run YOLOv5 trainings on a remote server, which is a more scalable and practical solution than local training. It specifically allows to boot a worker using Google Colab resources, including GPUs and TPUs, that can execute the training script of YOLOv5 in a seemless way. All training artefacts and metrics are surfaced and provide a simple way to verify that the training is working as expected.
Uploading the dataset to ClearML
Once you have installed the ClearML CLI and are logged in, the first step to execute remote training for YOLOv5 is to upload the dataset to ClearML. For that, simply recover the formatted dataset generated in the previous step, cd to its location run the following command.
clearml-data sync --project YOLOv5 --name NEPU --folder .
If succesful, you should see the dataset appear in the ClearML interface.
Booting the queue
To instanciate a remote queue, you need to create credentials within the settings of the ClearML interface. With the access key and secret key at hand, you can then duplicate the following Google Colab notebook to create a queue. When booting the queue, remember to select a runtime that has access to a GPU.
Running training
Once the dataset is uploaded to ClearML, and that you have your default queue running, you can trigger a remote run with the following command.
python train.py --batch 16 --epochs 3 --data clearml://<your_dataset_id> --weights yolov5s.pt
This command only triggers a test run, with a small batch size, a small number of epochs and the lightest possible YOLOv5 model version. Feel free to then try different experiment configurations to improve YOLOv5’s ability to recognise pumpjacks. I’ve found that with the free Colab resources quickly run out of memory if you try to increase the batch size too much.
Assembling a dataset of satellite images covering the Permian Basin
By then, it became clear that to get started, the modelling piece was mostly solved and that the only piece of the puzzle left was to find a scalable way to recover satellite images of a high enough resolution to make the pumpjacks visible. The scalability aspect being critical as the Permian Basin covers an area roughly equivalent to half of Germany.
There exists various commercial sources of satellite imagery, with different resolutions and coverage, such as Pleiades from Airbus, or Planet SkySat from UP42. Even though some of them support scientific research by providing free access, they generally require going through a thorough approval process. Quick investigations discouraged me to explore these options as my project was not backed by any academic or scientific institution.
I therefore chose to use the free datasets available through the Google Earth Engine (GEE). GEE offers access to many different datasets, including the National Agriculture Imagery Program (NAIP), which is a free dataset of aerial imagery of the United States, with a resolution of 1 meter. (That’s a higher resolution than the often used Landsat series, which have a resolution of 30 meters).
There are multiple ways one can use GEE to download satellite images covering an area, and it took me longer than I’d like to admit to figure out the best way to do it. With some trial and error, I could figure out the maximum area that one could download at once with a single request. With that information at hand, it then becomes possible to split the entire Permian basin into non overlapping tiles, of that area, and download all of them in a parallelised way.
You can follow along the code in the following Google Colab to extract a multitude of satellite images covering the area of your choice, using the NAIP dataset.
Be aware though that trying to cover the entire Permian Basin will generate a dataset of more than 15 GB and you might run out of space on your Google Drive if you’re using the free version.
Counting Texan oil wells
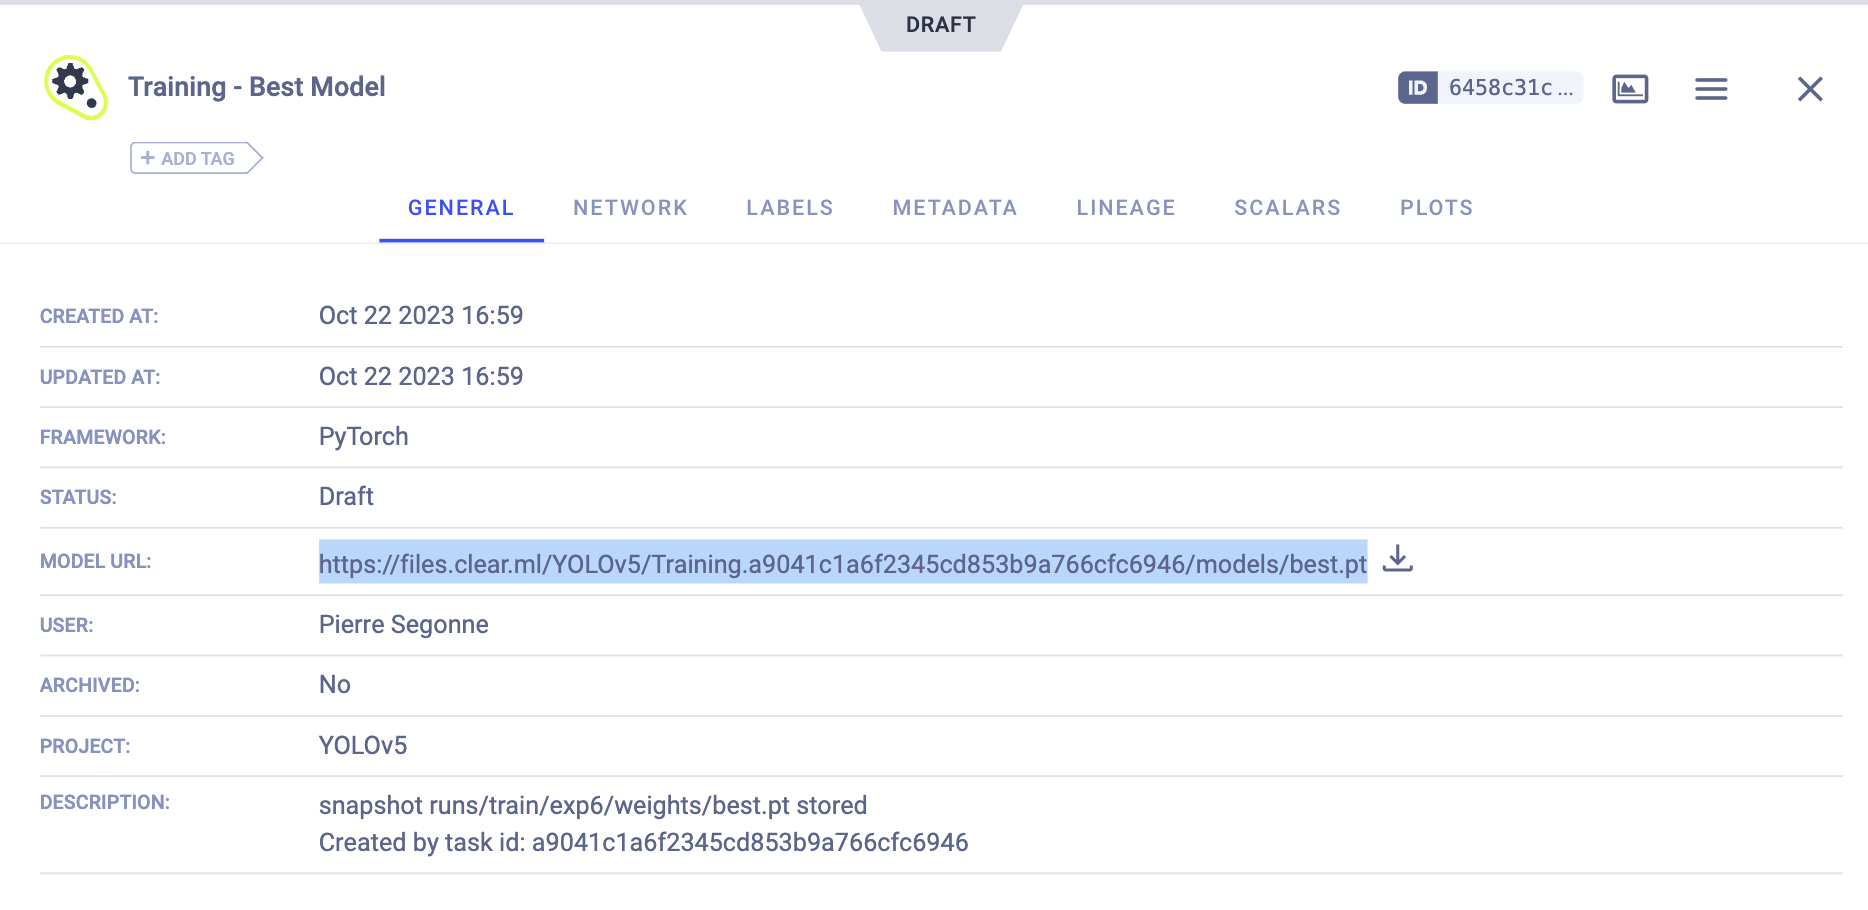
To execute the training model on the NAIP images, you need to download the best model weights from ClearML. The following figure shows you how to do so.
With your best.pt weights downloaded, you’ll also need to copy over the Permian Basin NAIP images. Head over to a local version of the YOLOv5 repository and copy both the model weights and sample images from the dataset at the root of the repository. With these files available you can finally execute the following command to run the model on the NAIP dataset.
python detect.py --weights models/best.pt --source sample_NAIP
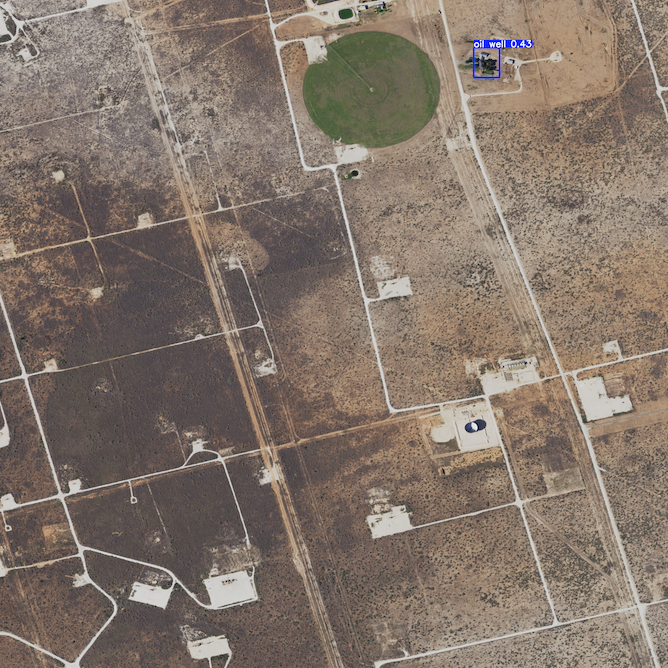
While the model is able to train quite accurately on the NEPU datase, reaching around 0.9 for both precision and recall, its execution on the NAIP dataset performs underwhelmingly. The model is not able to detect any oil wells within any sample of images.
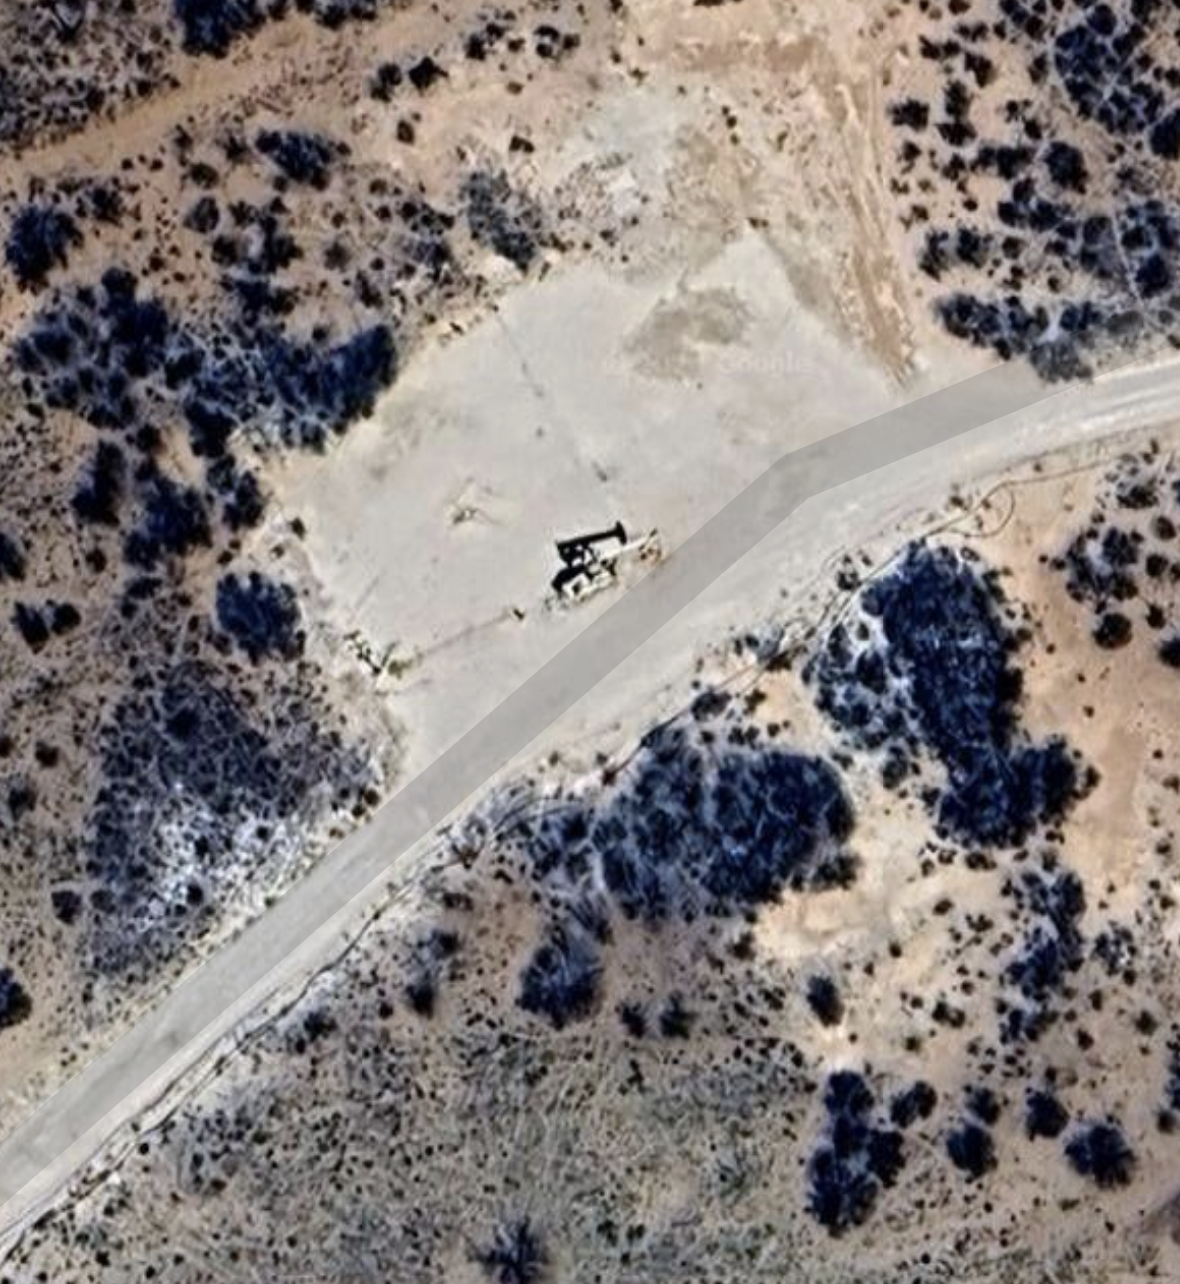
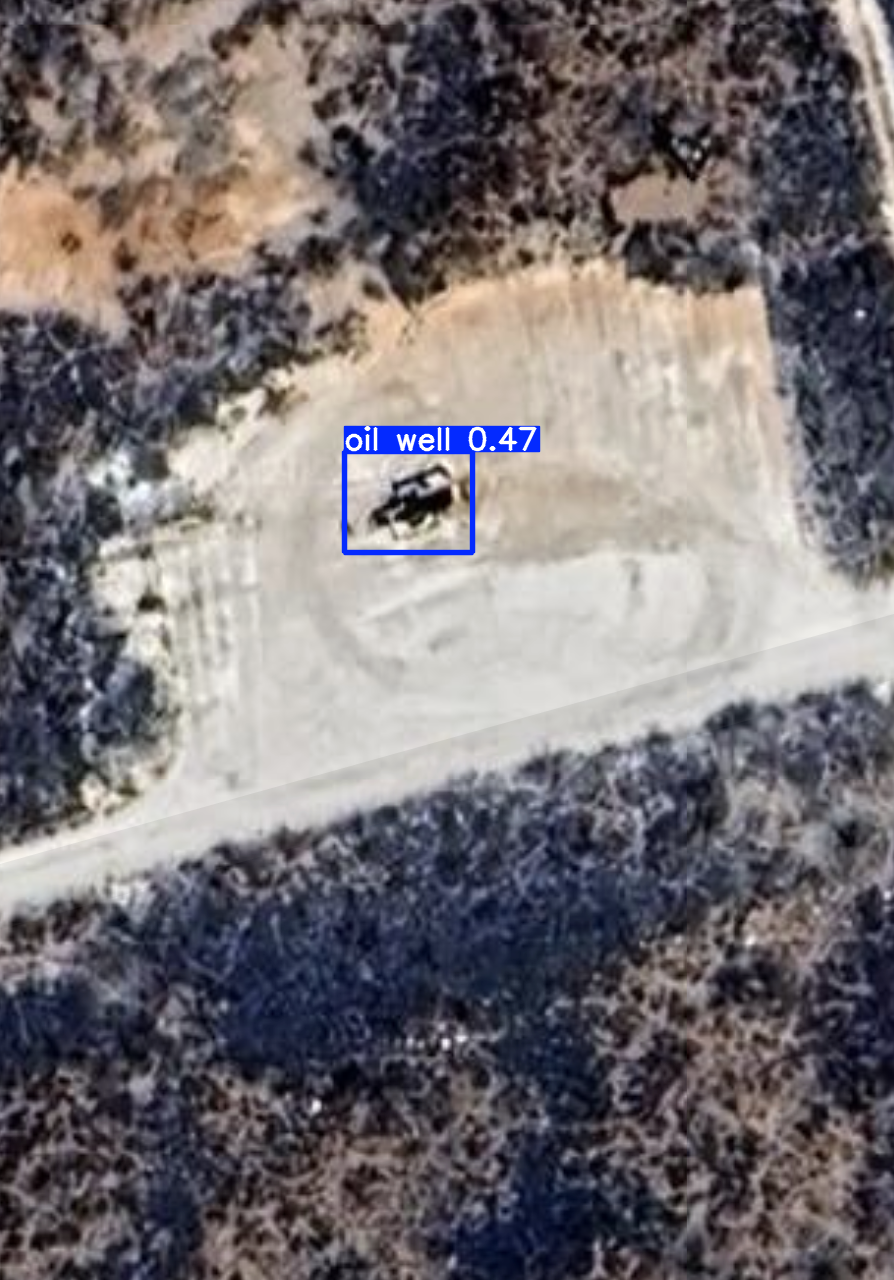
On the figure above, we can see that, for example, it mistakes a farm with a pumpjack. On the other hand, when trying to detect pumpjacks on higher resolution screenshots from Google Maps (see above), the model succeeds. The screenshots from Google Maps are actually from the Neo-Pleiades satellite, with a higher resolution.
That’s when I decided to throw in the towel. By that time, I had already spent free evening and weekend time on this idea, over a year’s time. Realising that my approach was almost certainly doomed to fail, as long as I wouldn’t be able to access high resolution satellite imagery for free, made me reconsider what motivated me to start this project in the first place.
Were I to be succesful, what would I have ended up with? A immense list of coordinates of oil wells, a staggering amount of detected objects. Would it have helped me make sense of the scale of our usage of fossil fuels? Not really. These numbers are too large to comprehend.
Conclusion
In the end, I have found that the best way to understand the scale of the fossil fuels infrastucture is to see it with your own eyes. Never will I forget the impression of minisculeness I felt when staring into the open wounds left by the Lignite exploitation in the Ruhr area. Never will I forget the stunning imagery of Lessons of Darkness; visions of hell unleashed on Earth.
When wrapping up this post, I was happy to see that initiaties attempting to do the same thing have emerged. Datasets of labeled oil wells have been expanded [5], opening a window of hope for those, with more dedication and patience than me, who want to use this approach to expose humanity’s insatiable appetite for fire.
